Calendar with bill due dates circled, including on that says pay rent

OCTOBER 6, 2022

Fannie Mae Joins Freddie, FHA to Use Rent Payments

By Talis Shelbourne

A majority of mortgage providers will now allow renters with thin credit scores to include on-time rent payments in the data a lender uses when considering approvals.

WASHINGTON – Fannie Mae launched its Multifamily Positive Rent Payment Reporting pilot program last week, offering a national lifeline to aspiring homeowners with no established credit history.

The program is expected to have a significant impact on cities with high renter populations and on groups that often have difficulty establishing credit.

Fannie Mae, officially the Federal National Mortgage Association, was created by Congress during the Great Depression. The public-private “government-supported enterprise” purchases mortgages from financial institutions.

Fannie Mae had already updated its computer-automated system last year to include bank records showing consistent rent payments by individuals. The system, called the Desktop Underwriter, is used by lenders to evaluate the creditworthiness of mortgage applicants.

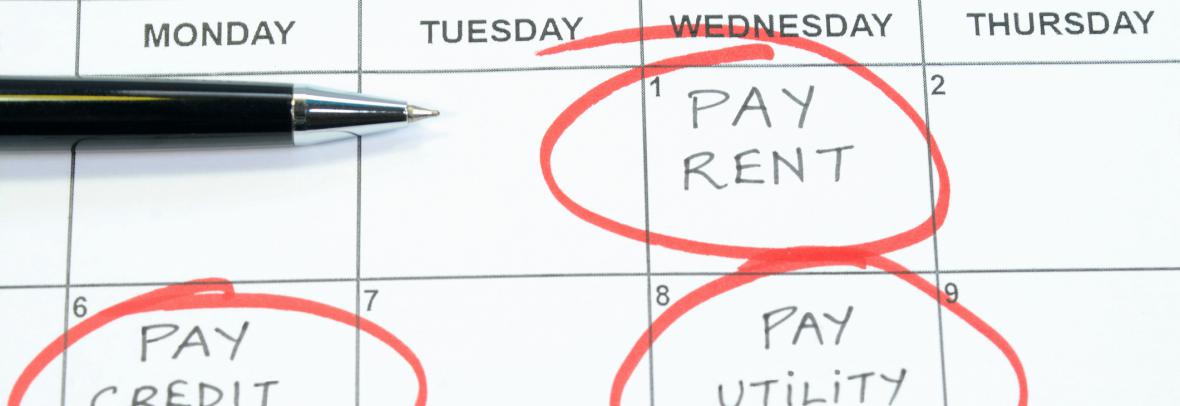
The change meant individuals could collect documentation of their rent payments made via check, electronically through a rental management’s payment portal and through other electronic methods connected to a bank and provide those to a mortgage lender as evidence of a good rental history. Freddie Mac and FHA loans previously announced rent-payment considerations.

This latest rent reporting program allows the renters of multifamily properties to report their rent payment history. As an incentive, Fannie Mae will cover the first year of costs associated with reporting that data.

According to Fannie Mae, if a renter misses a payment, they are automatically unenrolled so it does not damage their credit score; landlords, however, are allowed to report missed rent payments to credit agencies on their own, which would negatively impact credit history.

Credit is an essential part of the home buying process, and experts advise prospective homeowners achieve a credit score of at least 620 to get the best rates for a mortgage.

The lender ultimately decides to approve the loan. In some cases, Fannie Mae will purchase a loan to “guarantee” it, which means it is responsible for the debt if the borrower defaults.

© 2022 Journal Media Group.


Scott Bradley Brixen – ListReports Blog

Real Estate News

Interest rates for the average 30-yr, fixed-rate mortgage according to Freddie Mac’s PMMS hit:

4% in March 😟
5% in April 😰
6% in early-September 😨
7% (well, almost) in late-September 😱

The slowdown continues, but we have yet to see the impact of the most recent (massive) jump in mortgage rates on homebuyer demand.

August existing home sales dropped for the 7th straight month. Price growth decelerated further to “just” 8% YoY. [Source: Realtor.com]

Meanwhile, pending sales for August dropped 2% MoM and 24% YoY. The NAR now forecasts existing home sales to fall 15% YoY in 2022, with new home sales down 21% YoY. [Source: NAR]

Case-Shiller Index

Home price growth slowed to 15.8% YoY in July, from 18.1% YoY in June. That may not seem like much, but it’s the biggest 1-month drop in the index’s history.

Case-Shiller is the gold standard for home price appreciation because it tracks the sales prices of very similar homes across 20 big cities. It’s an ‘apples to apples’ comparison. But that accuracy comes at a cost…the data is 2 months old by the time we get it.

Mortgage Market

An extremely volatile week for the bond market (after the Fed raised rates 75bps) saw 30-year, fixed-rate mortgages briefly exceed 7% [with no points], before dropping back to around 6.75%. [Source: Mortgage News Daily]

Freddie Mac’s closely watched PMMS survey saw the interest rate on the average 30-year, fixed-rate mortgage climb to 6.7%. Keep in mind that this figure includes an average 0.9 points purchased. Without those points, the rate would have been at/ahead of 7%.

Still a Seller’s Market

Demand is falling and inventory has risen, but in most markets, well-priced homes are still selling very, very quickly.

In fact, the average Days on Market for sold properties has only edged up from 14 (in June & July) to 16 in August. In 2011 that figure was 96! Looked at another way, 81% of homes sold in August had been on the market less than a month.

That said, the average number of offers received for each property sold has plunged from a frenzied 5.5 in April 2022 to 2.5 in August. That’s actually getting pretty close to “normal” pre-pandemic levels of competition.

National Housing Stats

They Said It

“Success demands singleness of purpose. You need to be doing fewer things for more effect instead of doing more things with side effects. It is those who concentrate on one thing at a time who advance in this world.” — Gary Keller, The One Thing

“Our house is clean enough to be healthy and dirty enough to be happy” — Robyn Griggs Lawrence

Inspiration

The average duration of homeownership in the US is around 12 years. So if someone in your sphere of influence (SOI) bought a home in the last few years, there’s no reason to actively stay in touch with them, right? Wrong. Take the inverse of 12 (that’s 1/12) and you get 8.3%.

This means that, mathematically, 8% of your SOI is going to move in the next year…for reasons that you (and often they) couldn’t have predicted. Hockey legend Wayne Gretzky said “you miss 100% of the shots you don’t take.” In real estate, you probably lose 80–90% of the past clients that you don’t stay in contact with.


August 2022 Monthly Housing Market Trends Report


Sabrina Speianu, Economic Data Manager, realtor.com®

  • The national inventory of active listings increased by 26.6% over last year. 
  • The total inventory of unsold homes, including pending listings, increased by just 1.3% year-over-year due to a decline in pending inventory (-21.9%). 
  • Selling sentiment declined and listing activity followed, with newly listed homes declining by 13.4% on a year-over-year basis.
  • The median list price grew by 14.3% in August, a deceleration from recent highs.
  • Time on market was 42 days, 5 days more than last year but 22 days less than typical pre-pandemic levels.
  • Regionally, large Western markets which saw some of the most growth last year and earlier this year are now showing the greatest signs of deceleration, with larger inventory increases, more price reductions, and more quickly decelerating price growth than other regions. 

Read the FULL article


NAR Chief Economist Addresses Senate Committee

nar building washington dc

JULY 22, 2022

By Kerry Smith

Sales will weaken and for-sale inventory will grow, but it won’t do much to help affordability, Chief Economist Lawrence Yun said.

WASHINGTON – National Association of Realtors® (NAR) Chief Economist Lawrence Yun spoke before the U.S. Senate Committee on Banking, Housing and Urban Affairs as they dig deeper in an attempt to understand what’s happening in the U.S. housing market.

Yun told the committee that he doesn’t foresee a nationwide decline in home prices despite indications that price growth is set to slow. He testified that the potential for weaker sales should increase available for-sale inventory in some markets, but not enough to diminish persistent affordability constraints that, for many Americans, have kept homeownership out of reach for years.

“In the near term, I do not expect the situation to change appreciably,” Yun said Thursday. “Historic undersupply in the market, combined with continued demand, will likely drive ongoing issues with affordability for many Americans.

“Any short-term price adjustments, if they occur, will be less consequential compared to the immense longer-term housing affordability challenges we face as a country.”

Thursday’s hearing, Priced Out: The State of Housing in America, was recorded and can be viewed online.

The committee hearings come as the nation confronts a 6-million-unit housing shortage. The decades-in-the-making phenomenon has helped sustain year-over-year price growth for a record 124 consecutive months. A study of other circumstances influencing the market is also particularly compelling given COVID’s impact on U.S. housing and the more recent fluctuations in mortgage interest rates.

“When the Federal Reserve essentially went all-in in the early months of the pandemic … the decline in mortgage rates and the cautious reopening of the economy boosted housing demand,” said Yun. “The housing market always responds to changes in mortgage rates.”

Interest rates, which had been consistently in the 4-to-5% range in the decade preceding COVID-19, hovered near record lows of around 3% throughout much of 2020 and 2021. NAR’s most recent existing home sales report found that the average commitment rate for a 30-year, conventional, fixed-rate mortgage in June was up to 5.52%.

“Any increases in available inventory observed over the first half of this year have been offset by the corresponding increases in consumer costs,” Yun said on Capitol Hill, explaining that rate increases of roughly 2.5 percentage points have added about $800 per month to a median-priced house payment.

“This affordability crunch is felt most acutely as we move down the income scale and by minority households, given the current income distribution in America,” he continued. “That is why housing supply must be addressed to moderate home price and rent gains.”

© 2022 Florida Realtors®


Existing-Home Sales Retract 2.4% in April

May 19, 2022

Media Contact:  Quintin Simmons 202-383-1178

Key Highlights

  • Existing-home sales fell for the third straight month to a seasonally adjusted annual rate of 5.61 million. Sales were down 2.4% from the prior month and 5.9% from one year ago.
  • With slower demand, the inventory of unsold existing homes climbed to 1.03 million by the end of April, or the equivalent of 2.2 months of the monthly sales pace.
  • The median existing-home sales price increased at a slower year-over-year pace of 14.8% to $391,200.

“Higher home prices and sharply higher mortgage rates have reduced buyer activity,” said Lawrence Yun, NAR’s chief economist. “It looks like more declines are imminent in the upcoming months, and we’ll likely return to the pre-pandemic home sales activity after the remarkable surge over the past two years.”

Read full NAR article


Housing Market Update: More Sellers Drop Their Prices, But Buyers Find Little Relief

May 6, 2022 by Tim Ellis of Redfin

Median Sale Price

Homebuying is as competitive and costly as ever as soaring mortgage rates make the market less inviting for many would-be sellers.

The share of home sellers who dropped their asking price shot up to a six-month-high of 15% for the four weeks ending May 1, up from 9% a year earlier. The 5.9% increase is the largest annual gain on record in Redfin’s weekly housing data back through 2015. For homebuyers, the typical monthly mortgage payment skyrocketed a record 42% to a new high during the same period. Although a growing share of sellers are responding to the palpable drop in homebuyer demand by lowering their prices, sellers remain far outnumbered by buyers, so the typical home flies off the market at the fastest pace on record and for more than its asking price.

“Homebuyers continue to be squeezed in nearly every way possible, which is causing some to take a step back from the market,” said Redfin Chief Economist Daryl Fairweather. “Unfortunately for buyers hoping to find a deal as competition cools, sellers are pulling back even faster, which is keeping the market deep in seller’s territory. So even though price drops are becoming more common, most homes are still selling above asking price and in record time.”

Leading indicators of homebuying activity:

Median Asking Price
  • Fewer people searched for “homes for sale” on Google—searches during the week ending April 30 were down 7% from a year earlier.
  • The seasonally-adjusted Redfin Homebuyer Demand Index—a measure of requests for home tours and other home-buying services from Redfin agents—was down 1% year over year during the week ending May 1. It dropped 10% in the past four weeks, compared with a 1% decrease during the same period a year earlier.
  • Touring activity from the first week of January through May 1 was 24 percentage points behind the same period in 2021, according to home tour technology company ShowingTime.
  • Mortgage purchase applications were down 11% from a year earlier, while the seasonally-adjusted index increased 4% week over week during the week ending April 29.
  • For the week ending May 5, 30-year mortgage rates increased to 5.27%—the highest level since August 2009.

Key housing market takeaways for 400+ U.S. metro areas:

Unless otherwise noted, the data in this report covers the four-week period ending May 1. Redfin’s housing market data goes back through 2012.

Data based on homes listed and/or sold during the period:

  • The median home sale price was up 17% year over year—the biggest increase since August—to a record $396,125.
  • The median asking price of newly listed homes increased 16% year over year to $408,458, a new all-time high.
  • The monthly mortgage payment on the median asking price home rose to a record high of $2,404 at the current 5.27% mortgage rate. This was up 42%—an all-time high—from $1,688 a year earlier, when mortgage rates were 2.96%.
  • Pending home sales were down 4% year over year, the largest decrease since mid-February.
  • New listings of homes for sale were down 6% from a year earlier, and have been down from 2021 since mid-March.
  • Active listings (the number of homes listed for sale at any point during the period) fell 18% year over year.
  • 56% of homes that went under contract had an accepted offer within the first two weeks on the market, up from 54% a year earlier, down less than a percentage point from the record high during the four-week period ending March 27.
  • 42% of homes that went under contract had an accepted offer within one week of hitting the market, up from 41% a year earlier, down less than a percentage point from the record high during the four-week period ending March 27.
  • Homes that sold were on the market for a record-low median of 15.5 days, down from 21.2 days a year earlier.
  • A record 56% of homes sold above list price, up from 47% a year earlier.
  • On average, 3.7% of homes for sale each week had a price drop. Overall, 14.9% dropped their price in the past four weeks, up from 11.2% a month earlier and 9.1% a year ago. This was the highest share since mid-November.
  • The average sale-to-list price ratio, which measures how close homes are selling to their asking prices, rose to an all-time high of 102.8%. In other words, the average home sold for 2.8% above its asking price. This was up from 101% a year earlier.

Refer to our metrics definition page for explanations of all the metrics used in this report.

Median Mortgage Payment
Median Mortgage Payment Since 2015
Pending Sales
New Listings
Active Listings
Price Drops
Sale-to-List

How Homeownership Can Help Shield You from Inflation

How Homeownership Can Help Shield You from Inflation | MyKCM

If you’re following along with the news today, you’ve likely heard about rising inflation. You’re also likely feeling the impact in your day-to-day life as prices go up for gas, groceries, and more. These rising consumer costs can put a pinch on your wallet and make you re-evaluate any big purchases you have planned to ensure they’re still worthwhile.

If you’ve been thinking about purchasing a home this year, you’re probably wondering if you should continue down that path or if it makes more sense to wait. While the answer depends on your situation, here’s how homeownership can help you combat the rising costs that come with inflation.

Homeownership Offers Stability and Security

Investopedia explains that during a period of high inflation, prices rise across the board. That’s true for things like food, entertainment, and other goods and services, even housing. Both rental prices and home prices are on the rise. So, as a buyer, how can you protect yourself from increasing costs? The answer lies in homeownership.

Buying a home allows you to stabilize what’s typically your biggest monthly expense: your housing cost. If you get a fixed-rate mortgage on your home, you lock in your monthly payment for the duration of your loan, often 15 to 30 years. James Royal, Senior Wealth Management Reporter at Bankrate, says:

A fixed-rate mortgage allows you to maintain the biggest portion of housing expenses at the same payment. Sure, property taxes will rise and other expenses may creep up, but your monthly housing payment remains the same.” 

So even if other prices rise, your housing payment will be a reliable amount that can help keep your budget in check. If you rent, you don’t have that same benefit, and you won’t be protected from rising housing costs.

Use Home Price Appreciation to Your Benefit

While it’s true rising mortgage rates and home prices mean buying a house today costs more than it did a year ago, you still have an opportunity to set yourself up for a long-term win. Buying now lets you lock in at today’s rates and prices before both climb higher.

In inflationary times, it’s especially important to invest your money in an asset that traditionally holds or grows in value. The graph below shows how home price appreciation outperformed inflation in most decades going all the way back to the seventies – making homeownership a historically strong hedge against inflation (see graph below):

How Homeownership Can Help Shield You from Inflation | MyKCM

So, what does that mean for you? Today, experts say home prices will only go up from here thanks to the ongoing imbalance in supply and demand. Once you buy a house, any home price appreciation that does occur will be good for your equity and your net worth. And since homes are typically assets that grow in value (even in inflationary times), you have peace of mind that history shows your investment is a strong one.

Bottom Line

If you’re ready to buy a home, it may make sense to move forward with your plans despite rising inflation. If you want expert advice on your specific situation and how to time your purchase, let’s connect.


Myths About Today’s Housing Market

Myths About Today’s Housing Market [INFOGRAPHIC] | MyKCM

Some Highlights

  • If you’re planning to buy or sell a home today, it’s important to be aware of common misconceptions.
  • Whether it’s timing your purchase as a buyer based on home prices and mortgage rates or knowing what to upgrade or repair before listing your house as a seller, it takes a professional to guide you through those decisions.
  • Let’s connect so you have an expert to help separate fact from fiction in today’s housing market.

The Future of Home Price Appreciation and What It Means for You

The Future of Home Price Appreciation and What It Means for You | MyKCM

Many consumers are wondering what will happen with home values over the next few years. Some are concerned that the recent run-up in home prices will lead to a situation similar to the housing crash 15 years ago.

However, experts say the market is totally different today. For example, Odeta Kushi, Deputy Chief Economist at First American, tweeted just last week on this issue:

“. . . We do need price appreciation to slow today (it’s not sustainable over the long run) but high price growth today is supported by fundamentals- short supply, lower rates & demographic demand. And we are in a much different & safer space: better credit quality, low DTI [Debt-To-Income] & tons of equity. Hence, a crash in prices is very unlikely.”

Price appreciation will slow from the double-digit levels the market has seen over the last two years. However, experts believe home values will not depreciate (where a home would lose value).

To this point, Pulsenomics just released the latest Home Price Expectation Survey – a survey of a national panel of over 100 economists, real estate experts, and investment and market strategists. It forecasts home prices will continue appreciating over the next five years. Below are the expected year-over-year rates of home price appreciation based on the average of all 100+ projections:

  • 2022: 9%
  • 2023: 4.74%
  • 2024: 3.67%
  • 2025: 3.41%
  • 2026: 3.57%

Those responding to the survey believe home price appreciation will still be relatively high this year (though half of what it was last year), and then return to more normal levels over the next four years.

What Does This Mean for You as a Buyer?

With a limited supply of homes available for sale and both prices and mortgage rates increasing, it can be a challenging market to navigate as a buyer. But buying a home sooner rather than later does have its benefits. If you wait to buy, you’ll pay more in the future. However, if you buy now, you’ll actually be in the position to make future price increases work for you. Once you buy, those rising home prices will help you build your home’s value, and by extension, your own household wealth through home equity.

As an example, let’s assume you purchased a $360,000 home in January of this year (the median price according to the National Association of Realtors rounded up to the nearest $10K). If you factor in the forecast for appreciation from the Home Price Expectation Survey, you could accumulate over $96,000 in household wealth over the next five years (see graph below):

The Future of Home Price Appreciation and What It Means for You | MyKCM

Bottom Line

If you’re trying to decide whether to buy now or wait, the key is knowing what’s expected to happen with home prices. Experts say prices will continue to climb in the years ahead, just at a slower pace. So, if you’re ready to buy, doing so now may be your best bet for your wallet. It’ll also give you the chance to use the future home price appreciation to build your own net worth through rising equity. If you want to get started, let’s connect today.