Mortgage rates hit their lowest average since September 2022

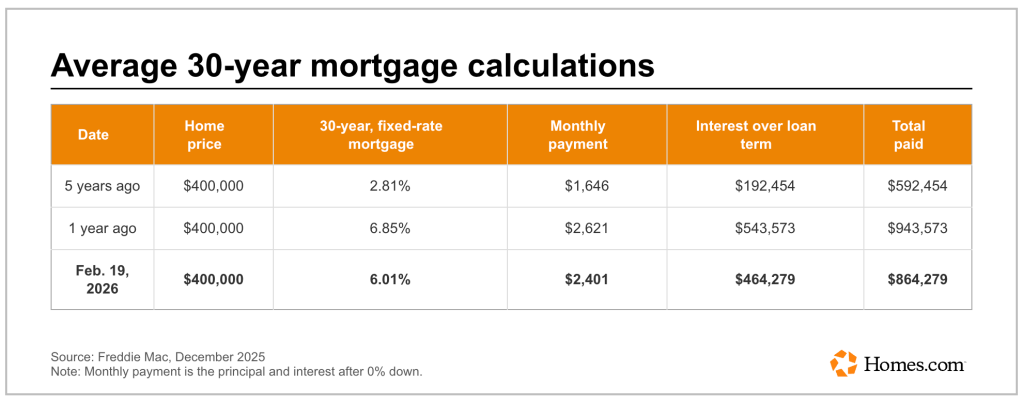
The 30-year, fixed-rate stood at 6.01% as of Thursday

Two residential homes are shown side by side in a suburban setting, with bare trees and shrubbery in the foreground.
Economists are hopeful that lower mortgage rates could bring buyers back to the market this spring. (Greg Dunbar/CoStar)

By Moira Ritter -Homes.com

February 19, 2026

Key takeaways

  • Mortgage rates fell to their lowest averages since September 2022, with the 30-year fixed at 6.01% and the 15-year at 5.35%.
  • Lower rates have fueled a sharp increase in refinancing, but home sales and pending contracts remain weak amid affordability challenges and winter conditions.
  • Economists expect spring to bring more buyer activity, with millions of households newly able to qualify for a mortgage at today’s rates.

Mortgage rates are at their lowest averages since September 2022.

As of Thursday, the 30-year, fixed-rate mortgage averaged 6.01%, according to mortgage giant Freddie Mac. It’s the second consecutive week of declines. This time last year, the average was 6.85%.

Line graph showing weekly average US home mortgage rates from December 2021 to December 2025. The 30-year fixed rate is represented in orange, while the 15-year fixed rate is in blue, with rates fluctuating between 2% and 8%.

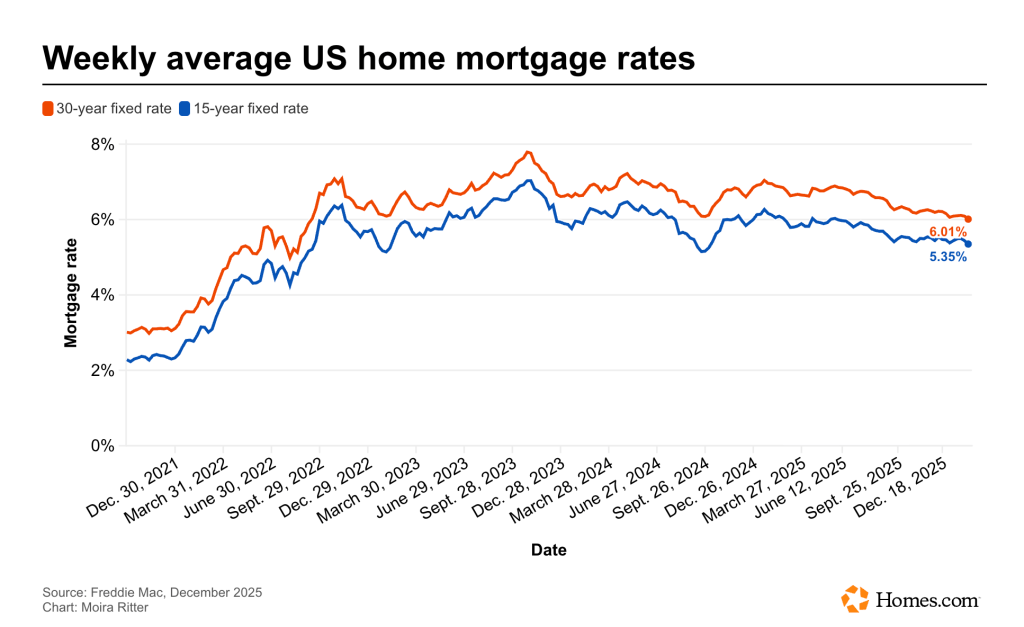
The 15-year, fixed-rate mortgage also saw a drop in the week ended Thursday, averaging 5.35%. That’s down from last week’s average (5.44%) rate and last year’s (6.04%).

On a daily basis, mortgage rates were unchanged, according to Mortgage News Daily. The 30-year, fixed-rate mortgage was at 6.05%, and the 15-year, fixed-rate mortgage stood at 5.62% as of Thursday afternoon.

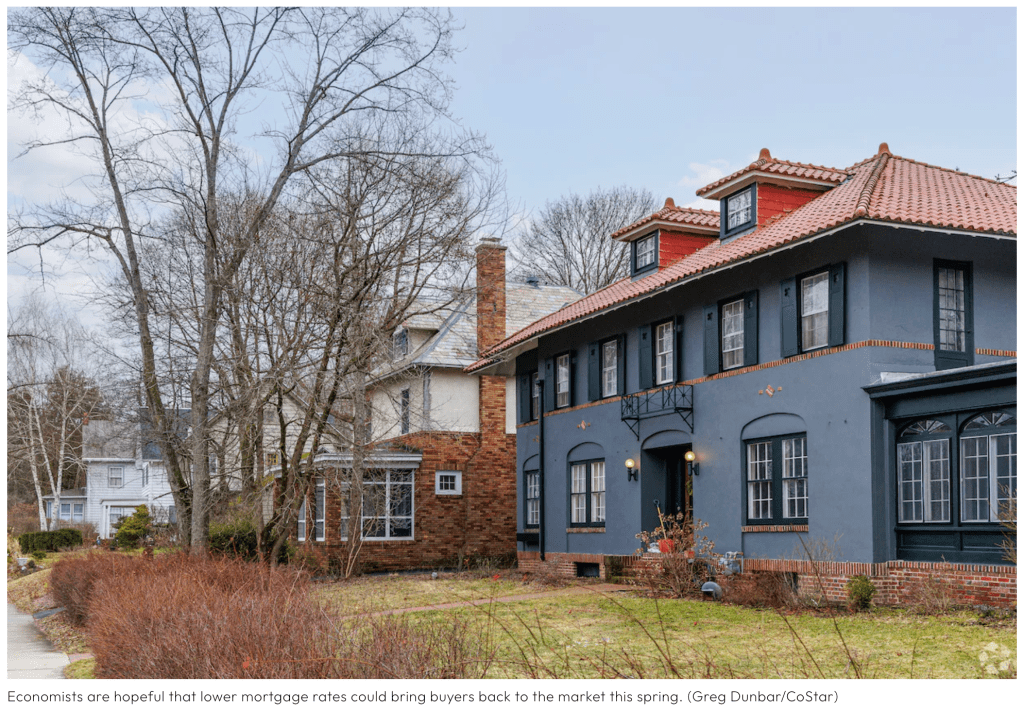
Lower mortgage rates could bring more buyers back to the market

The recent downward shift in mortgage rates has yet to translate to a shift in home sales, but experts are hopeful that the spring market — and weather — will bring at least a little more activity.

Applications for home purchases, for example, are higher than a year ago, but on a weekly basis they’ve been more volatile, according to data from the Mortgage Bankers Association. Refinance demand, however, has been on the upswing.

“This lower rate environment is not only improving affordability for prospective homebuyers, it’s also strengthening the financial position of homeowners,” Sam Khater, chief economist at Freddie Mac, said in a statement Thursday. “Over the past year, refinance application activity has more than doubled, enabling many recent buyers to reduce their annual mortgage payments by thousands of dollars.”

Table showing average 30-year mortgage calculations for a home price of $400,000 over three different time periods: 5 years ago, 1 year ago, and February 19, 2026, including mortgage rates, monthly payments, interest over loan term, and total paid.

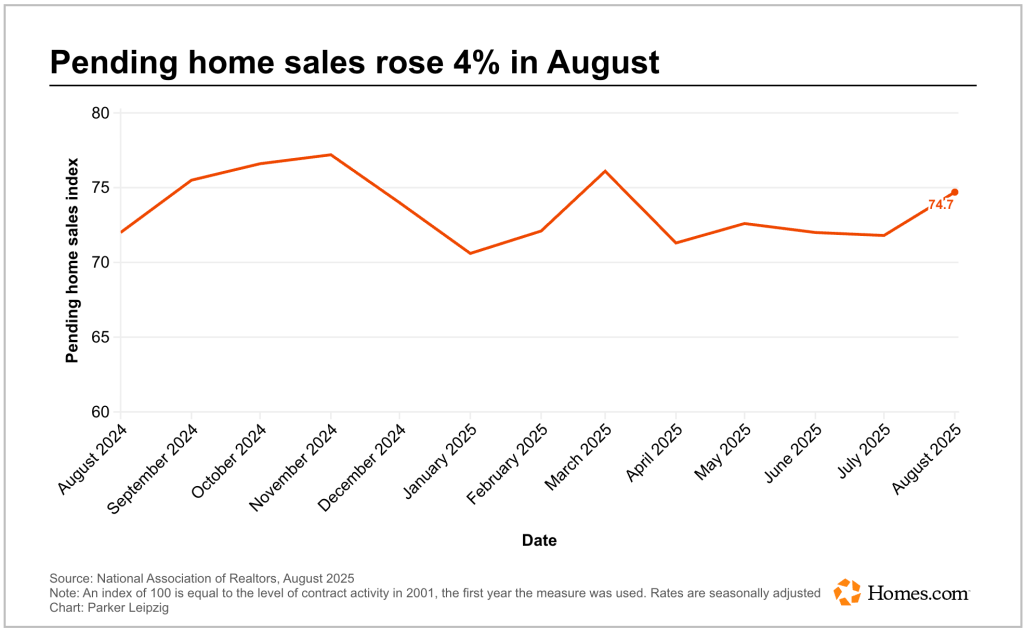
At the same time, the National Association of Realtors’ latest existing and pending home sales reports have been lackluster. In December, sales of pre-owned homes fell 8.4%, the sharpest monthly drop in roughly four years.

On Thursday, the association reported that pending home sales — the number of signed contracts for single-family houses, townhouses, condominiums and co-ops — declined in January on both a monthly and annual basis. The report is considered a leading indicator for where the market and buyer demand are headed.

Taken together, the data reflects a slow market driven by buyers hampered by affordability barriers — or winter weather.

Even so, there’s optimism that the spring could bring more activity, especially with the expected seasonal influx of inventory. Lawrence Yun, chief economist at the NAR, noted that an additional 5.5 million households that couldn’t afford a mortgage last year could now qualify at today’s lower rates.

“Most newly qualifying households do not act immediately, but based on past experience, about 10% could enter the market — potentially adding roughly 550,000 new homebuyers this year compared with last year,” he said in a statement Thursday.


Is the dreaded mortgage ‘lock-in’ effect losing its grip on sellers?

Share of homeowners with rates above 6% has overtaken those under 3%

Owners' low rates have discouraged many from selling. Above, houses in Westbrook, Maine. (Jeff Tippett/CoStar)
Owners’ low rates have discouraged many from selling. Above, houses in Westbrook, Maine. (Jeff Tippett/CoStar)

By David Holtzman – Homes.com

January 14, 2026

The housing market recently reached a milestone that suggests the “lock-in” effect, discouraging home sellers from putting their properties on the market, is slowly on its way out.

In the second half of 2025, more homeowners had mortgages with rates at or above 6% than those with loans below 3%, according to the Federal Housing Finance Agency. It was the first time this had been the case since late 2020, during the midst of the COVID-19 pandemic.

Since the first quarter of 2022, when the U.S. Federal Reserve began raising interest rates to counter the impact of rapidly escalating inflation, the share of homeowners with rates below 3% has been slowly declining.

From a peak of 24.6% in early 2022, the figure had fallen to 20% by the third quarter of 2025. Meanwhile, owners with rates at or above 6% climbed from 7.3% in mid-2022 to 21.2% late last year.

The pandemic is what led to the lock-in effect, a situation in which numerous owners have very low mortgage rates when the marketplace average is far higher. People who already own a house don’t want to sell and buy another property if it means they will lose their low rate. They are “locked in,” pressured to stay where they are rather than put their homes up for sale.

This phenomenon has been troublesome for the housing market, leading to a scarcity of existing homes for potential buyers already burdened by today’s much higher mortgage rates. The lack of available homes was one of the reasons why the median age of first-time homebuyers reached a record 40 years old in 2025, with existing owners staying in their houses much longer than in the past.

“The median expected tenure in a purchased home is now 15 years, with 28% of buyers declaring it’ll be their ‘forever home’ and that they never intend to move,” the National Association of Realtors reported in its 2025 Profile of Home Buyers and Sellers. “This marks a significant increase from 2000 to 2008 when sellers typically stayed in their homes for just six years.”

Graph showing the percentage of homeowners with mortgage rates below 3% (in blue) and above 6% (in orange) from Q1 2019 to Q3 2025, highlighting trends and significant events like the COVID-19 lockdown and the Federal Reserve raising interest rates in Q1 2022.

The lock-in effect has also posed problems for economic growth in general, as it means people are less likely to relocate for better job opportunities, according to a 2023 paper by Lu Liu, an assistant professor of financeat the University of Pennsylvania’s Wharton School.

Other factors motivate sellers

This trend, along with the slow decline in average mortgage rates for buyers, could motivate some people to get off the sidelines.

“This definitely boosts activity a little bit,” Steve Trautwein, senior loan officer for Intercoastal Mortgage LLC in Northern Virginia, told Homes.com. “It’s not world-changing, it’s not a big shot to the markets, “but it’s a meaningful step forward.”

What Trautwein has seen more in recent months is people who decide to sell because they need to move for a job or some other reason, rather than shifts in mortgage rates.

“I personally sold a house this summer with a [sub-3%] mortgage on it so the sellers could move to where they needed to be,” he said.

The largest share of outstanding mortgages currently, almost a third, falls within the range of 3% to 4%, according to the FHFA. Therefore, there are still many homeowners with rates significantly lower than the average 30-year rate, which was just over 6% last week.

“Eventually, more of those locked into low rates will be forced to move due to life cycle or financial reasons, bringing more inventory to the real estate market,” Melissa Cohn, regional vice president of William Raveis Mortgage, told Homes.com. “If mortgage rates were to decline into the mid-5s or lower, we would see more and more people willing to give up their low rates and make the move that they have been waiting to do.”


A ‘little bit better’ housing market could be on the way in 2026, says NAR chief economist

Lawrence Yun forecasts 14% increase in sales at annual industry conference.

Real estate professionals gathered in Houston on Friday to hear from National Association of Realtors Chief Economist Lawrence Yun. (Moira Ritter/Homes.com)

By Moira Ritter Caroline Broderick
November 17, 2025

Standing on stage in front of a cavernous hall at the George R. Brown Convention Center in Houston, Lawrence Yun made a bold announcement: “America is now open for business.”

The chief economist for the National Association of Realtors was met with an uproar of applause and cheers from his audience — real estate professionals from across the globe gathered in Texas for the industry group’s largest annual gathering, NAR NXT.

“The shutdown is over,” Yun said, referencing the record-breaking 43-day government shutdown that ended last week. “Expect some of the deals that did not go through during the shutdown to now slowly catch up.”

Yun’s overall message on Friday: Slightly better times are on the way for the housing market.

It’s a reversal from the message he delivered just about five-and-a-half months ago at another of the group’s conferences. “The recovery has been delayed,” Yun said in June.

In Houston, though, Yun was more optimistic.

“The forecast is that it looks like this year is a bummer, no increase in unit sales at all,” he said. “Next year is really the year you see some measurable increase in sales.”

“The light is flashing at the end of the tunnel,” Yun added.

Expectations for mortgage rates next year

One of the biggest determinants of whether that light at the end of the tunnel will come into fruition is mortgage rates.

“We have to get a more positive interest rate environment where people are saying, ‘Oh, since I don’t need to move up, now I’m more willing because it’s affordable,’” Mark Perkins — founder, CEO and principal broker at Pivot Realty — told Homes.com in an interview Friday.

National Association of Realtors Chief Economist Lawrence Yun forecast a better housing market in 2026 than in 2025. (Moira Ritter/Homes.com)

Yun said that’s a change that’s likely to manifest in 2026, forecasting that the 30-year, fixed-rate mortgage will fall from an average of 6.7% to 6% next year. Furthermore, he predicted the Federal Reserve would cut interest rates again in December and potentially twice again in 2026. While that’s not directly related to mortgage rates, Fed decisions send ripples through the economy that typically extend to the mortgage market.

“As we go into next year, mortgage rates will be even a little bit better,” he said. “I definitely am using the adjective ‘little bit better.’ It’s not going to be a big decline, but you will still see some modest decline that will help improve some affordability.”

It’s important to remember, though, that Yun made a similar prediction last year, forecasting that rates would end 2025 around 6%. Instead, mortgage rates spent much of this year closer to the 7% threshold. As of Thursday, the average 30-year, fixed-rate mortgage was 6.24%.

Will home prices increase or decrease in 2026?

National Homes.com market data has shown modest increases in home prices for the past several months, sticking in the singular digits and landing on a median home price of $385,000 in October.

But prices are not in a risk zone, said Yun, nor will they be next year.

“Home prices are essentially at a solid ground. Any price decline appears to be temporary oversupply, as it’s happened here in the Houston region,” he said, referencing the high level of inventory spurred from pandemic-induced buyer demand for the Sun Belt. In response, that demand was also met by homebuilder activity.

National Association of Realtors’ housing market predictions20252026
Existing home sales+0%+14%
New home sales-2%+5%
Median home price+3%+4%
Mortgage rate6.7%6.0%

Yun said home prices nationally increased 3% this year, and next year will increase by 4%. A 4% increase from October’s median price would push median prices up by $15,400.

“Home prices nationwide are in low danger of declining. Some cities, yes, but probably temporary,” he said.

What’s to come for home sales in 2026?

This past year posted an unfortunate zero percent increase in existing home sales and a 2% decline in new home sales, according to Yun, but that’s a reality lived by many agents working in the industry.

What’s hopeful and promising increased sales, the economist said, is the high share of mortgage application activity.

The conference is the industry group’s largest gathering of the year. (Moira Ritter/Homes.com)

“Mortgage applications, even though some are not mortgage approvals, has been consistently above last year, implying that peoples’ desire to enter the market has been consistently positive,” he told the crowd. “They just want a little lower mortgage rate, more inventory to get the deals done.”

With that, Yun predicted a 14% year-over-year increase in existing home sales, and a modest 5% uptick in new home sales.

But from the frontline, that increase might not be enough to retreat to normalcy, suggested agent Anthony Lamacchia of Lamacchia Realty in Plantsville, Connecticut. For the New England agent, the most exciting prospect is what lies beyond 2026.

“I don’t think we’re going to see a normal year with an average amount of sales until we get to [2027], and then beyond that, we’re going to see a boom like we’ve never seen, and you can quote me on that one,” he told Homes.com in an interview. “It will be a boom like America’s never seen at the end of this decade.

Homes.com, part of CoStar Group, was a sponsor of the NAR show.


Home prices rose 2% in September, as listings topped pre-pandemic levels, new Homes.com data shows

The median cost for a single-family property was $385,000

Pittsburgh saw the biggest jump in prices in September — 7.6% — of the top 40 markets tracked by Homes.com. (Anthony Kelly/CoStar)


By Moira Ritterhomes.com

The cost to purchase a median-priced home in the United States grew 2% in September compared to the same time a year earlier, ending a summer that saw a slight uptick in price growth.

New data from Homes.com revealed that in September, the median price for a single-family home was $385,000, an increase of $7,500 from the same period in 2024. Although it’s an annual uptick, September’s median price is still below June’s peak of $395,000.

All told, the pricing data fits into the broader consensus among some housing economists and experts that the market showed signs of moderating in September. In addition to slower price appreciation compared to this time last year, mortgage rates have also decreased since the beginning of the summer.

At the same time, Homes.com data showed that listings were up 8.1% in September compared to a year earlier — the highest volume of listings added to the market in September since 2021. The increase sent inventory past pre-pandemic levels, another sign that the balance between supply and demand is improving.

“Easing mortgage rates and improved inventory conditions have helped improve market balance, even as prices remain just below the summer peak,” according to Erika Ludvigsen, national director of residential analytics at Homes.com.

Geographical trends reflect a market that is rebalancing

While the overall picture shows cautious optimism, the reality at the local level is varied.

Of the nearly 1,000 markets tracked by Homes.com, 63% experienced annual price increases and 37% saw annual price decreases. Among the top 40 markets, 10 saw their median prices remain flat or decline, while another 10 experienced price increases of 3% or higher.

A large share of that growth was concentrated in the Midwest, a continuation of an existing trend, according to the Homes.com data. For example, Detroit, St. Louis, Cleveland and Kansas City, Missouri, were among markets with the largest increase in September home sale prices.

On the opposite end of that spectrum, many of the markets that saw their prices stay flat or decline were in the Sun Belt region— where there’s currently an oversupply of houses. In September, those markets included places such as Richmond, Virginia; Raleigh, North Carolina; Atlanta; Austin, Texas; and Houston.

“The geographical trends in price appreciation reflect market rebalancing,” Ludvigsen told Homes.com. The Midwest region’s stability is attributed to steady demand and fewer new deliveries, which have helped maintain pricing power. Many Sun Belt metros saw rapid homebuilding during and after the pandemic. This has led to excess supply and price moderation. “There was also variation in how price growth manifested across housing types.

While detached single-family home prices increased about 1.8% to a median price of $390,000 in September, the prices for attached housing and condos remained unchanged compared to a year earlier.Writer


Drop In Mortgage Rates Helps Boost Contracts To Buy Existing Homes In August

Pending sales increased in three of the four US regions, with Midwest leading way.

Pending sales were up 4.2% in the South, including in Kentucky neighborhoods like this one in Louisville. (Cory Cornelius/CoStar)

By David Holtzman – Homes.com
September 29, 2025

A slow but steady decline in mortgage rates in August led to more buyers signing contracts to purchase existing single-family homes and condos.

Pending sales of these properties increased 4% during the month, according to data the National Association of Realtors released Monday. Since the same time period a year earlier, contracts increased 3.8%. These figures could be a sign that actual sales are expected to rise over the next two months, since deals usually take 30 to 60 days to close.

“Lower mortgage rates are enabling more homebuyers to go under contract,” NAR Chief Economist Lawrence Yun said in a statement.

Actual sales of existing homes fell in August, as buyers didn’t appear to be responsive to the gradual decline in mortgage rates at that point.

August saw other positive signs for buyers, the Mortgage Bankers Association said last week, as the median monthly payment amount that home loan applicants had requested dropped $27 to $2,100.

“Affordability conditions have improved for four straight months, with lower mortgage rates and stronger income growth boosting prospective buyers’ purchasing power,” Edward Seiler, MBA’s associate vice president, said in a statement Thursday.

Contracts to sell homes increased in August from the previous month in three of the four major U.S. regions, with the more affordable Midwest leading the way at 8.7% and the West up 5%. The South also increased 3.1%, while in the Northeast, pending sales fell 1.1%.

Since August 2024, contracts have risen 6.7% in the Midwest, 4.2% in the South, 2.6% in the Northeast and 0.2% in the West.

Nineteen percent of agents are optimistic they’ll see an increase in buyer activity over the next three months, according to a monthly NAR survey, up from 16%. Fewer agents reported they anticipate a rise in seller traffic, however.

Existing homeowners should be ready to make deals with buyers, as indicated not only by a steady increase in the supply of homes for sale, but also by sellers’ strong financial position, Ryan Sweet, chief economist for Oxford Economics, said in a statement Monday. Sellers across the U.S. have accumulated a cumulative $36 trillion in real estate equity, much of it since the pandemic, he said. That should mean they don’t necessarily feel locked in by the low mortgage rates they obtained when they bought their homes and are open to selling now.

“The noticeably larger than anticipated increase in pending-home sales between July and August is a tentative sign that the housing market is beginning to thaw and we haven’t reaped the benefits of the recent slide in mortgage rates,” Ryan Sweet, chief economist for Oxford Economics, said in a statement Monday.Writer


Is It A Buyers Market? It Depends

Lisa Sturtevant PhD Bright MLS, Housing Economist

Inventory is climbing, which has been welcome news for prospective homebuyers. However, the inventory picture is very different depending on where you are and the type of home you’re looking for.

According to data from realtor.com, at the end of May 2025, total inventory across the U.S. was at about 90% of the May 2019 level. But a very distinct pattern emerges when you look at inventory by metro area. Inventory levels surpass 2019 levels in southern metros in Florida, Texas, and Arizona as well as in Washington and Oregon in the Pacific Northwest. By contrast, inventory across the Midwest and Northeast, as well as in Southern California, remains below 2019 levels.

Mid-Atlantic inventory remains tight

In the Bright MLS service area, which covers six states and the District of Columbia, there were 42,981 active listings on the market at the end of May 2025. The number of active listings is now 25.1% higher than it was a year ago and inventory has been increasing across the Mid-Atlantic region for 16 consecutive months, as more homes are listed for sale and properties remain on the market longer.

However, despite the rapid rise, inventory is still well below pre-pandemic levels in most local markets across the Bright MLS service area. Overall, May 2025 inventory is just 64% of the May 2019 level across Bright’s footprint. In fact, there are just a handful of counties in the region where inventory has surpassed 2019 levels.

The urban area housing markets tend to have more inventory. In both Philadelphia and Washington, D.C., inventory is above pre-pandemic levels. In the close-in suburbs of Arlington and Alexandria, Virginia, inventory has also surpassed what was available to buyers in 2019.

There are many more local markets where inventory is still less than half of what was available in 2019. In most of the Philadelphia suburbs, for example, the number of active listings in May 2025 is less than 50% of May 2019 levels.

So, while more inventory is a welcome change for homebuyers in the marketplace, inventory is still relatively tight across much of the Mid-Atlantic region and sellers do still have the upper hand in the market.

read full Bright MLS article


Why the Data Matters

Contrary to the negative reports surrounding the market, people continue to move. Not everyone can or wants to wait. Job changes, growing families, downsizing, and other life events often dictate timing more than market trends. That’s why I start with the numbers. Not very exciting, I know but they’re essential. Understanding the data fosters informed decisions and an easier, less stressful path toward your unique real estate goals. I’m here to provide the numbers, break them down, demonstrate how they may affect you and guide you through the best way forward.  DM me any time, and/or book a planning session


FHFA House Price Index Up 0.2% in January

Outside of Federal Housing Finance agency building

March 25, 2025

FHFA House Price Index Up 0.2% in January

U.S. house prices rose 4.8% year over year, from Jan. 2024 to Jan. 2025. For the nine census divisions, monthly home price changes ranged from -0.8% to +1%.

WASHINGTON — U.S. house prices rose 0.2% in January, according to the U.S. Federal Housing (FHFA) seasonally adjusted monthly House Price Index (FHFA HPI®). House prices rose 4.8% from January 2024 to January 2025. The previously reported 0.4% price growth in December was revised upward to 0.5%.

Among the nine census divisions, seasonally adjusted monthly home price changes ranged from a -0.8% in the South Atlantic division to +1.0% in the West North Central division. The 12-month changes were all positive, ranging from +2.4% in the West South Central division to +8.2% Middle Atlantic division.

The FHFA HPI is a comprehensive collection of publicly available house price indexes that measure changes in single-family home values based on data that extend back to the mid-1970s from all 50 states and over 400 American cities. It incorporates tens of millions of home sales and offers insights about house price changes at the national, census division, state, metro area, county, ZIP code, and census tract levels. FHFA uses a fully transparent methodology based upon a weighted, repeat-sales statistical technique to analyze house price transaction data.

FHFA releases HPI data and reports quarterly and monthly. The flagship FHFA HPI uses seasonally adjusted, purchase-only data from Fannie Mae and Freddie Mac. Additional indexes use other data, including refinances, mortgages insured by the Federal Housing Administration, and real property records. All the indexes (including their historic values) and information about future HPI release dates are available on FHFA’s website.

The next HPI report will be released April 29, 2025, and will include monthly data through February of 2025.

© 2025 Florida Realtors®


How Trump’s Tariffs Are Reshaping Real Estate

As reported by The Real Deal — National Real Estate News
March 16, 2025
President Donald Trump’s second-term trade policies are shaking up the market in ways that landlords, developers and homebuyers can’t afford to ignore. From surging rents to stalled construction projects, the impact of tariffs is rippling through the industry. The uncertainty surrounding Trump’s tariffs and economic policies is pushing potential homebuyers to the sidelines, and that hesitation is driving rental prices to record highs

In New York City, Manhattan’s median rent hit a fresh high of $4,500 in February — its highest level since 2023. Brooklyn and Queens are feeling the pressure too, with Brooklyn rents averaging over $4,000 and Northwest Queens surpassing $3,400.

Chicago isn’t far behind. Downtown apartment rents just broke the $3,000 threshold for the first time ever, and with supply cratering due to high construction costs, developers are holding back — meaning rents are only expected to spike further in 2025.

Tenants are afraid to take the plunge into homeownership amid fluctuating mortgage rates and economic instability. The result is lower vacancy rates, more bidding wars and landlords with the upper hand. With summer around the corner, expect even higher rents in the months ahead.

While mortgage rates have dipped since Trump’s return to the White House, experts say the unpredictability surrounding his tariffs is outweighing any potential savings — causing some renters who once considered buying to think again.

The outlook for new homes isn’t any rosier, and homebuilders are scrambling. Trump’s tariffs on steel, aluminum and lumber imports are driving up costs, forcing builders to get creative. Some are stockpiling materials, gambling that today’s prices are better than what’s to come. Others are shrinking floor plans or pivoting to modular construction. The National Association of Home Builders estimates these tariffs could add $7,500 to $10,000 to the cost of a new home. And in places like California, where developers are already dealing with fire recovery costs, the added expense could mean the difference between rebuilding and walking away from projects altogether.

Politicians and pundits are pointing fingers at Commerce Secretary Howard Lutnick as the architect of Trump’s tariff strategy.

While Trump’s unpredictability has long been a hallmark of his economic policy, the former Cantor Fitzgerald head’s mixed messaging is keeping investors and industry players on edge.

In Texas, where industrial development has been booming, big players like Ross Perot Jr. are considering baking “tariff clauses” into contracts to prepare for rising costs. Meanwhile, Citadel founder Ken Griffin isn’t mincing words — calling Trump’s trade policies a “huge mistake” that could cripple the economy. Huge mistake or not, the uncertainty and chaos surrounding Trump’s tariffs is certainly making it difficult to stay ahead of the curve.

Jobs Market Still Healthy, but Uncertainty Drives Mortgage Rates Lower

Danielle Hale, Chief Economist for Realtor.com
March 7, 2025

Greater D.C. Area: Weekly Housing Market Update

Monitor the latest market activity in and around the nation’s capital with our experts’ week-by-week data breakdown. 
March 10,  2025 by Lisa Sturtevant, Phd

  • New listing activity rising seasonally in the D.C. region. The number of new listings coming on the market this past week is higher than last week, which is a typical seasonal trend. In the Washington D.C. region, new listings rose by 10.5% compared to last week. Across the overall Bright MLS service area, new listings were up 10.9% week-to-week. Early March tends to be the time of the year when prospective sellers are getting set to list in anticipation of the spring housing market.  
  • Listings are still relatively higher in the Washington D.C. region though it is still too early to tell the extent to which DOGE is impacting homeowners. A total of 2,050 new listings came onto the market across the greater Washington D.C. region last week, which was 20.5% higher than the same week a year ago. Listings were up just 14.3% year-over-year in the broader Bright MLS footprint. If D.C. area homeowners were selling because they were impacted by federal government layoffs or back-to-the office mandates, we will continue to see relatively higher listing activity in the region in the weeks to come. 
  • The Southern Maryland market may be one to watch. In Calvert County and Charles County in Maryland, new listing activity spiked this week. While it’s not possible to attribute this activity to federal government workforce changes, this market is one to watch. About one in five workers living in Calvert and Charles counties is a civilian federal government worker, according to data from the 2023 American Community Survey. In addition, these Southern Maryland communities attracted a lot of homebuying activity during the pandemic, including many workers who were able to work remotely at the time and may now be called back to the office. 
  • Buyers are still out in the Washington D.C. region. There were 1,600 new pending contracts on homes in the D.C. region last week, a 12.1% increase compared to a week ago. This is a stronger week-to-week gain than we see in the broader Bright MLS service area and is a testament to the on-going demand within the area’s housing market. Places with more listing activity—for example, Calvert and Charles counties—saw some of the strongest uptick in new pending contract activity, as buyers took advantage of the increased availability of homes for sale.