
Average Long-Term Mortgage Rates Dip for 9th Straight Week

calculator with key on keyring with house on paperwork that says mortgage

DECEMBER 29, 2023 By Matt Ott

Freddie Mac says mortgage rates slid to the lowest level since May, “economy remains on firm ground with solid growth.”

WASHINGTON (AP) – The average long-term U.S. mortgage rate retreated for the ninth week to reach its lowest level since May.

The average rate on a 30-year mortgage dipped to 6.61% from 6.67% last week, mortgage buyer Freddie Mac said Thursday. A year ago, the rate averaged 6.42%.

Borrowing costs on 15-year fixed-rate mortgages, popular with homeowners refinancing their home loans, also inched down this week, with the average rate falling to 5.93% from 5.95% last week. A year ago, it averaged 5.68%, Freddie Mac said.

“Heading into the new year, the economy remains on firm ground with solid growth, a tight labor market, decelerating inflation, and a nascent rebound in the housing market,” Sam Khater, Freddie Mac’s chief economist.

Mortgage rates have been easing since late October, when the average rate on a 30-year home loan reached 7.79%, the highest level since late 2000.

The decline has tracked the trajectory of the 10-year Treasury yield, which lenders use as a guide to pricing loans. The yield, which in mid-October surged to its highest level since 2007, has been falling on hopes that inflation has cooled enough for the Federal Reserve to shift to cutting interest rates after yanking them dramatically higher since March of 2022.

The Fed has opted to not move rates at its last three meetings, which has also given financial markets a boost.

Investors’ expectations for future inflation, global demand for U.S. Treasurys and what the Fed does with its benchmark federal funds rate can influence rates on home loans.

The sharp run-up in mortgage rates that began early last year has pushed up borrowing costs on home loans, reducing how much would-be homebuyers can afford even as home prices have kept climbing due to a stubbornly low supply of properties on the market. That’s weighed on sales of previously occupied U.S. homes, which are down 19.3% through the first 11 months 2023.

Despite the recent decline, the average rate on a 30-year home loan remains sharply higher than just two years ago, when it was 3.11%. The large gap between rates now and then contributes to the low inventory of homes for sale by discouraging homeowners who locked in rock-bottom rates two years ago from selling.

Some housing economists are forecasting that home sales will increase next year, assuming that mortgage rates ease further.

© 2023 The Associated Press. All rights reserved. This material may not be published, broadcast, rewritten or redistributed without permission.


Latest Data Shows Home Prices, Rates May Improve

Bar chart with arrows and houses

NOVEMBER 17, 2023

Freddie Mac Chief Economist: “New data indicate inflationary pressures are receding” – which, along with lower mortgage rates, may lure more homebuyers into the market.

JONESBORO, Ga. – Mortgage rates have fallen for three straight weeks, with the 30-year fixed rate averaging 7.44% Thursday, down from 7.5% a week earlier, according to Freddie Mac.

But the rate remains well above last year’s level – 6.61%.

Why did the rate go down this week? “New data indicate that inflationary pressures are receding,” said Sam Khater, Freddie Mac’s chief economist.

The government reported Nov. 14 that consumer prices climbed 3.2% in the 12 months ended in October, decelerating from 3.7% in September.

“The combination of continued economic strength, lower inflation and lower mortgage rates should likely bring more potential homebuyers into the market,” Khater said.

Housing sales slump

But so far this year, high mortgage rates have stifled sales.

Existing-home sales slid 2% in September from August, according to the National Association of Realtors (NAR). Sales retreated 15.4% from a year ago.

“As has been the case throughout this year, limited inventory and low housing affordability continue to hamper home sales,” said NAR Chief Economist Lawrence Yun.

But with inventory limited, demand has been strong enough, despite the mortgage rate increase, to push home prices higher. The median existing-home price registered $394,300 in September, up 2.8% from $383,500 a year earlier.

“Lack of inventory is providing the support for high prices, but it’s also making it super difficult for first-time buyers to enter the housing market,” Yun noted.

Yun expects the depressed state of sales to last through year-end, with home sales dropping 18% for 2023 as a whole. That comes after a 17% decline last year.

Light at the end of the tunnel?

But things are starting to look up on the supply side. The inventory of unsold existing homes climbed 2.7% in September from August to 1.13 million. That’s the equivalent of 3.4 months’ supply at the current monthly sales pace. Six months is typically considered a balanced market.

“Builders are back on their feet, up 5% in newly constructed home sales year to date,” Yun said. “Builders can simply create inventory. In a housing shortage environment, builders are really benefiting.”

And mortgage rates may have topped out. Many economists believe inflation is falling enough to keep the Federal Reserve from raising rates again.

“I believe we’ve already reached the peak in terms of interest rates,” Yun said. “The question is when are rates going to come down?”

He forecast mortgage rates will slide to 6%-7% by the spring buying season and anticipates that more sellers will then enter the market.

Still, if you’re a renter who wants to buy, you might want to hold off until housing prices correct. For many, mortgage payments are just too high for a house to be affordable. The rule of thumb is that no more than 28% of your income should be needed to pay a mortgage.

Copyright © 2023 Clayton News Daily. All rights reserved.


Home prices ticked up in April as market faced a mixed bag

One new figure shows home prices rose in April compared to March but fell year over year. Economists, however, are fairly upbeat

Home prices ticked up in April as market faced a mixed bag

Photo by DALL-E

BY JIM DALRYMPLE II
June 28, 2023

A pair of reports out Tuesday reveals that U.S. home prices ticked up slightly in April compared to March, though the reports also offered mixed signals about how well the market is holding up over the longer term.

Selma Hepp

Selma Hepp

Of Tuesday’s new numbers, the S&P CoreLogic Case-Shiller Index shows the biggest month-over-month gains in April, rising 1.3 percent. In a blog post on the numbers, CoreLogic Chief Economist Selma Hepp described this uptick as a “strong gain” for home prices and notes that it suggests “homebuying activity is heating up in many markets.”

“In addition, price gains among high-tier homes are once again showing a strong rebound,” Hepp added in a statement.

April’s gains represent the third consecutive month of home price increases, according to a report on the index.

Credit: CoreLogic

Also on Tuesday, the U.S. Federal Housing Finance Agency released its monthly FHFA House Price Index report. That report shows that home prices rose 0.7 percent in April compared to March.

Both the FHFA House Price Index and the S&P CoreLogic Case-Shiller Index are respected measures of U.S. home prices. Broadly speaking, they tend to highlight the same trends, though differences in methodology mean they don’t produce exactly the same numbers.

For example, the two indexes weigh differently valued homes in different ways, and the FHFA House Price Index includes reappraisals while the S&P CoreLogic Case-Shiller Index does not.

Interestingly, the two figures were in disagreement about what happened to home prices in April 2023 compared to April 2022. Year over year, the S&P CoreLogic Case-Shiller Index experienced a 0.2 percent decline in April — a drop that Hepp described as “the first annual loss since April of 2012.”

However, the report on the FHFA House Price Index states that in April prices actually rose 3.1 percent year over year. Despite that uptick, Nataliya Polkovnichenko — supervisory economist in FHFA’s Division of Research and Statistics — said that “house prices in some regions of the country continued to decline” in April.

The S&P CoreLogic Case-Shiller Index report also highlights some regional variation, with Miami seeing the biggest year-over-year price gains at 5.2 percent. Boston and Cleveland experienced the biggest month-over-month gains, at 2.9 percent and 2.3 percent, respectively.

Credit: CoreLogic

The report also reveals that month-over-month gains in many metro areas actually outpaced what was happening before the COVID-19 pandemic.

Economists generally responded to Tuesday’s new numbers with optimism. In a statement, Bright MLS Chief Economist Lisa Sturtevant suggested “a summer rebound” could be in the works thanks to “this surprisingly resilient housing market.” And she suggested, “this could be the turning point for home prices.”

Lisa Sturtevant

Sturtevant also points to high demand as a key factor in the current market.

“Rising mortgage rates were supposed to quell homebuyer demand and push home prices down,” Sturtevant said. “As rates escalated last year, buyer activity did stall. However, higher mortgage rates have not dampened buyer interest as much as many thought (or hoped) they would. As a result, while the Case-Shiller index showed a decline in April, the big home price drops some had predicted have not materialized.”

In a similar vein, George Ratiu — chief economist for real estate insights and analytics company Keeping Current Matters — said in a statement that the S&P CoreLogic Case-Shiller Index numbers “highlighted a spring housing market regaining its footing after a winter of dire forecasts.”

George Ratiu

Ratiu went on to note that demand rebounded in the spring, but that it also “ran headlong” into limited supply. That dynamic pushed prices higher and, to the surprise of some buyers, resulted in “multiple bids on well-priced properties,” Ratiu said. He added that this outcome is “an unexpected turn of events from the doom-and-gloom forecasts issued at the start of the year.”

“Real estate fundamentals remain out of balance, with demand still outpacing supply, and have a way to go toward health,” Ratiu said. But he also ultimately concluded that the “return of seasonal patterns is reinforcing the view that we are moving in a promising direction.”

Email Jim Dalrymple II


illustration of houses with red graphic line showing

APRIL 7, 2023

Why Does It Still Feel Like a Seller’s Market?

By Kerry Smith

RE usually sees cycles between buyer’s and seller’s markets, but this time it’s a bit different. Supply vs. demand hasn’t changed because both sides pulled back.

SEATTLE – New listings fell 21.8% year-to-year during the four weeks ending April 2, one of the biggest drops since the start of the pandemic, according to a Redfin study.

An increasing number of homeowners don’t want to move because they still have generational-low mortgage rates secured only a few years ago. While rates have fallen for four weeks in a row, according to this week’s report, they’re still about twice as high as they were before 2021.

As a result, buyers unafraid of current mortgage rates quickly scoop up new listings. Of homes going under contract, nearly half are doing so within two weeks; at the beginning of 2023, it was about 25%.

“Elevated mortgage rates are perhaps an even bigger deterrent for would-be sellers than for would-be buyers,” says Redfin Deputy Chief Economist Taylor Marr. “Giving up a 3% mortgage rate for one in the 6% range is a tough pill to swallow. Today’s serious homebuyers have grown accustomed to the idea of a 5% or 6% rate and have adjusted their budgets accordingly.”

“Shiny new listings are getting multiple offers and selling fast. The caveat is that they have to be priced correctly from the beginning,” says Denver Redfin agent Stephanie Collins. “One of my buyers recently made an offer on a move-in ready home in a popular area. The home was priced right in line with the market at $520,000; it received eight offers and went for $560,000 to a competing buyer.”

Florida ranks near top for rising home prices

In cities where buyer demand outpaces seller supply, home prices continue to go up – and Florida is home to three of the top five U.S. cities for price increases.

While Milwaukee led the nation for price increases (up 11.4% year-to-year), Fort Lauderdale came in second (up 8.9%), followed by West Palm Beach (up 8.2%), Miami (up 7.9%) and Columbus, Ohio (up 6.3%).

On the flipside, the top five price declines in the U.S. were largely on the West Coast: Home prices dropped in 28 of the U.S.’s 50 most populous metros, with the biggest drop in Austin, Texas (down 14.7% year-to-year), Sacramento (down 11.7%), Oakland, California (down 10.4%), San Jose (down 10.2%) and Seattle (down 9.6%).

© 2023 Florida Realtors®


Back of man starting at huge dollar bill with arrow in front heading lower

MARCH 30, 2023

Mortgage Rates Hit Lowest Level in 6 Weeks

By Matt Ott

At 6.32%, the average 30-year, fixed-rate mortgage declined from last week’s average 6.42% – a ray of hope for buyers seeking to secure a home this spring.

WASHINGTON – The average long-term U.S. mortgage rate inched down this week to its lowest level in six weeks, just as the spring buying season gets underway.

Mortgage buyer Freddie Mac reported Thursday that the average on the benchmark 30-year rate fell for the third straight week to 6.32%, from 6.42% last week. The average rate a year ago was 4.67%.

The recent decline in mortgage rates is good news for prospective homebuyers, as many were pushed to the sidelines during the past year as the Federal Reserve cranked up its main borrowing rate nine straight times in a bid to bring down stubborn, four-decade high inflation.

Also helping buyers, home prices appear to be leveling off. The national median home price slipped 0.2% from February last year to $363,000, marking the first annual decline in 13 years, according to the National Association of Realtors.

One thing that hasn’t gotten much better is the supply of homes.

“Over the last several weeks, declining rates have brought borrowers back to the market, but as the spring home buying season gets underway, low inventory remains a key challenge for prospective buyers,” said Sam Khater, Freddie Mac’s chief economist.

Rising borrowing costs can add hundreds of dollars a month in costs for homebuyers and put the brakes on the housing market. Before surging 14.5% in February, sales of existing homes had fallen for 12 straight months to the slowest pace in more than a dozen years.

In 2022, existing U.S. home sales fell 17.8% from 2021, the weakest year for home sales since 2014 and the biggest annual decline since the housing crisis began in 2008, the National Association of Realtors reported earlier this year.

The average long-term rate hit 7.08% in the fall – a two-decade high – as the Federal Reserve quickly cranked up its key lending rate with multiple jumbo hikes in a bid to cool the economy and stymie persistent, four-decade high inflation.

In their latest quarterly economic projections, the policymakers forecast that they expect to raise that key rate just once more – from its new level of about 4.9% to 5.1%, the same peak they had projected in December.

While the Fed’s rate hikes do impact borrowing rates across the board for businesses and families, rates on 30-year mortgages usually track the moves in the 10-year Treasury yield, which lenders use as a guide to pricing loans. Investor expectations for future inflation, global demand for U.S. Treasurys and what the Federal Reserve does with interest rates can also influence the cost of borrowing for a home.

Treasury yields have fluctuated wildly since the collapse of two mid-size U.S. banks two weeks ago. The yield on the 10-year Treasury, which helps set rates for mortgages and other important loans, was 3.57% Thursday, but had been above 4% early in March.

The rate for a 15-year mortgage, popular with those refinancing their homes, fell this week to 5.56% from 5.68% last week. It was 3.83% one year ago.

Copyright 2023 The Associated Press. All rights reserved. This material may not be published, broadcast, rewritten or redistributed without permission.


Weekly Housing Market Update -2/17/2023

This week, Chief Economist Danielle Hale discusses what small business optimism, consumer and producer inflation data, and retail sales data signal about the U.S. economy. She also highlights what these data imply for the Fed’s likely path forward.

0:10 – Business optimism trends
0:25 – Inflation trends
1:24 – Mortgage rates
1:40 – Construction trends
2:11 – Real estate listings trends


At 6.14%, Weekly Mortgage Rates Hit Sept. Lows

Back of man starting at huge dollar bill with arrow in front heading lower

JANUARY 19, 2023

It’s down from last week’s 6.33%. Freddie Mac’s chief economist says it provides a “much-needed boost” for the housing market, but inventory is a concern.

Copyright 2023 The Associated Press. All rights reserved.

WASHINGTON (AP) – The average long-term U.S. mortgage rate fell this week to its lowest level since September, a potential boost to the housing market which has been in decline for nearly a year.

Mortgage buyer Freddie Mac reported Thursday that the average on the benchmark 30-year rate fell to 6.15% from 6.33% last week. A year ago the average rate was 3.56%.

The average long-term rate reached a two-decade high of 7.08% in the fall as the Federal Reserve continued to boost its key lending rate in its quest to cool the economy and tame inflation.

The big rise in mortgage rates during the past year has throttled the housing market, with sales of existing homes falling for 10 straight months to the lowest level in more than a decade.

Though home prices have retreated as demand has declined, they are still nearly 11% higher than a year ago. Higher prices and a doubling of mortgage rates have made homebuying much less affordable for many people, but recent rate declines could give some homebuyers new hope.

“Rates are at their lowest level since September of last year, boosting both homebuyer demand and homebuilder sentiment,” said Sam Khater, Freddie Mac’s chief economist. “Declining rates are providing a much-needed boost to the housing market, but the supply of homes remains a persistent concern.”

At its final meeting of 2022, the Federal Reserve raised its rate 0.50 percentage points, its seventh increase last year. That pushed the central bank’s key rate to a range of 4.25% to 4.5%, its highest level in 15 years.

Though inflation at the consumer level has declined for six straight months, Fed officials have signaled that they may raise the central bank’s main borrowing rate another three-quarters of a point in 2023, which would be in a range of 5% to 5.25%.

Rates for 30-year mortgages usually track the moves in the 10-year Treasury yield, which lenders use as a guide to pricing loans. Investors’ expectations for future inflation, global demand for U.S. Treasurys and what the Federal Reserve does with interest rates can also influence the cost of borrowing for a home.

The rate for a 15-year mortgage, popular with those refinancing their homes, also declined this week, to 5.28% from 5.52% last week. It was 2.79% one year ago.


NAR: 3Q Home Prices Up in 98% of Metros

By Kerry Smith -NOVEMBER 11, 2022

Home prices rose 8.6% in 3Q, with 46% of metros seeing double-digit price growth – a drop from 80% in 2Q. Of the top 10 high-price-increase metros, 7 are in Fla.

WASHINGTON – An overwhelming majority of metro markets saw home price gains in the third quarter of 2022, according to the National Association of Realtors® (NAR). That increase was in spite of rising mortgage rates that approached 7% and declining sales.

Of the 185 metros NAR tracks, 46% had double-digit price increases, though that’s down from 80% in the second quarter.

The national median single-family existing-home price climbed 8.6% year-to-year to $398,500. While still a notable price increase, it’s down from the 14.2% recorded in the previous quarter.

“Much lower buying capacity has slowed home price growth and the trend will continue until mortgage rates stop rising,” says NAR Chief Economist Lawrence Yun. “The median income needed to buy a typical home has risen to $88,300 – that’s almost $40,000 more than it was prior to the start of the pandemic back in 2019.”

Among the major U.S. regions, the South registered the largest share of single-family existing-home sales (44%) and the greatest year-over-year price appreciation (11.9%) in the third quarter. Prices were up 8.2% in the Northeast, 7.4% in the West, and 6.6% in the Midwest.

Fla. has 7 of top 10 metros for price growth

  1. North Port-Sarasota-Bradenton – 23.8%
  2. Lakeland-Winter Haven – 21.2%
  3. Myrtle Beach-Conway-North Myrtle Beach, S.C.-N.C. – 21.1%
  4. Panama City – 20.5%
  5. Deltona-Daytona Beach-Ormond Beach – 19.6%
  6. Port St. Lucie – 19.4%
  7. Greenville-Anderson-Mauldin, S.C. – 18.9%
  8. Kingsport-Bristol-Bristol, Tenn.-Va. – 18.8%
  9. Tampa-St. Petersburg-Clearwater – 18.8%
  10. Ocala (18.8%

10 most expensive markets in the U.S.

  1. San Jose-Sunnyvale-Santa Clara, Calif. – $1,688,000; 2.3%
  2. San Francisco-Oakland-Hayward, Calif. – $1,300,000; -3.7%
  3. Anaheim-Santa Ana-Irvine, Calif. – $1,200,000; 9.1%
  4. Urban Honolulu, Hawaii – $1,127,400; 7.6%
  5. San Diego-Carlsbad, Calif. – $900,000; 5.9%
  6. Los Angeles-Long Beach-Glendale, Calif. – $893,200; 3.8%
  7. Boulder, Colo. – $826,900; 7.5%
  8. Naples-Immokalee-Marco Island – $746,600; 16.7%
  9. Seattle-Tacoma-Bellevue, Wash. – $741,300; 4.6%
  10. Boston-Cambridge-Newton, Mass.-N.H. – $698,900; 6.2%

“The more expensive markets on the West Coast will likely experience some price declines following this rapid price appreciation, which is the result of many years of limited home building,” Yun says. “The Midwest, with relatively affordable home prices, will likely continue to see price gains as incomes and rents both rise.”

Higher cost for monthly payments

In the third quarter of 2022, stubbornly high home prices and increasing mortgage rates reduced housing affordability. The monthly mortgage payment on a typical existing single-family home with a 20% down payment was $1,840. That’s a marginal increase from the second quarter ($1,837) but a significant year-to-year jump of $614 – or 50%.

Families typically spent 25% of their income on mortgage payments, down from 25.3% in the prior quarter, but up from 17.2% one year ago.

“A return to a normal spread between the government borrowing rate and the home purchase borrowing rate will bring the 30-year mortgage rates down to around 6%,” Yun says. “The usual spread between the 10-year Treasury yield and the 30-year mortgage rate is between 150 to 200 basis points, rather than the current spread of 300 basis points.”

First-time buyer challenges

First-time buyers looking to purchase a typical home during the third quarter of 2022 continued to feel the impact of housing’s growing unaffordability. For a typical starter home valued at $338,700 with a 10% down payment loan, the monthly mortgage payment rose to $1,808 – nearly identical to the previous quarter ($1,807) but an increase of almost $600 (49%), from one year ago ($1,210).

First-time buyers typically spent 37.8% of their family income on mortgage payments, up from 36.8% in the previous quarter. A mortgage is considered unaffordable if the monthly payment (principal and interest) amounts to more than 25% of the family’s income.

A family needed a qualifying income of at least $100,000 to afford a 10% down payment mortgage in 59 markets, up from 53 in the prior quarter. Yet, a family needed a qualifying income of less than $50,000 to afford a home in 17 markets, down from 23 in the previous quarter.

© 2022 Florida Realtors®


Real Estates Current Market Silver Lining

For those looking for the good news about today’s real estate market. A bit of a deep dive, about 60 minutes worth but excellently delivered. Three main facts tell us it’s not all doom and gloom. Combine them with the time of year and the general fear that has most buyers/sellers on the sidelines, spells opportunity. (40:00). We can help should you decide to take advantage of today’s market.

  • Historical trends, what happens after quantitative tightening (12:00)
  • Demographics, there’s a lot of millennials (24:50)
  • Inventory levels, yes they are still historically low (22:00)


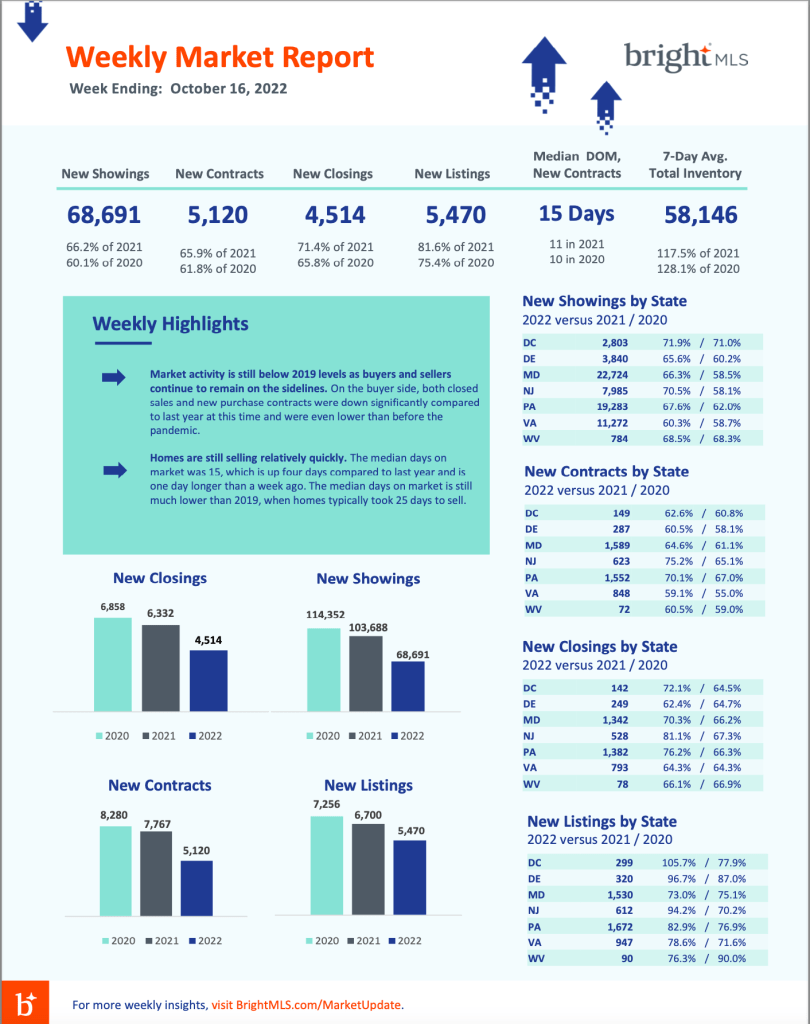
Weekly Market Report: Week Ending Oct. 16

Access this weekly report for real-time data on residential market activity across the Bright MLS footprint.
October 17,  2022 Lisa Sturtevant, PhD

Here are the highlights for the week ending October 16, 2022:

  • Inventory continues to increase throughout the Bright footprint. The average number of active listings during the week ending October 16 was up 17.5% compared to the same week a year ago. Active listings edged up 0.9% compared to last week, which is the second weekly increase in a row. Despite these increases, overall supply across the region remains very low.
  • Market activity is still below 2019 levels as buyers and sellers continue to remain on the sidelines. On the buyer side, both closed sales and new purchase contracts were down significantly compared to last year at this time and were even lower than before the pandemic. Closed sales this week were about 14% lower than the same week during 2019, while the number of new purchase contracts tracked 22% lower than during the same week in 2019.
  • There was a slight uptick in both new purchase activity and new listings compared to a week ago. Typically, both the number of new purchase contracts and new listings decline during the second week of October. This year, however, there were slight increases, with new purchase contracts 2.1% higher than a week ago and new listings up 3.0% week-to-week. These weekly increases could indicate some buyers and sellers are starting to act in anticipation of higher mortgage rates later this fall.
  • Homes are still selling relatively quickly. The median days on market was 15 during the week ending October 16, which is up four days compared to last year and is one day longer than a week ago. The median days on market is still much lower than 2019, when homes typically took 25 days to sell.