Is It A Buyers Market? It Depends

Lisa Sturtevant PhD Bright MLS, Housing Economist

Inventory is climbing, which has been welcome news for prospective homebuyers. However, the inventory picture is very different depending on where you are and the type of home you’re looking for.

According to data from realtor.com, at the end of May 2025, total inventory across the U.S. was at about 90% of the May 2019 level. But a very distinct pattern emerges when you look at inventory by metro area. Inventory levels surpass 2019 levels in southern metros in Florida, Texas, and Arizona as well as in Washington and Oregon in the Pacific Northwest. By contrast, inventory across the Midwest and Northeast, as well as in Southern California, remains below 2019 levels.

Mid-Atlantic inventory remains tight

In the Bright MLS service area, which covers six states and the District of Columbia, there were 42,981 active listings on the market at the end of May 2025. The number of active listings is now 25.1% higher than it was a year ago and inventory has been increasing across the Mid-Atlantic region for 16 consecutive months, as more homes are listed for sale and properties remain on the market longer.

However, despite the rapid rise, inventory is still well below pre-pandemic levels in most local markets across the Bright MLS service area. Overall, May 2025 inventory is just 64% of the May 2019 level across Bright’s footprint. In fact, there are just a handful of counties in the region where inventory has surpassed 2019 levels.

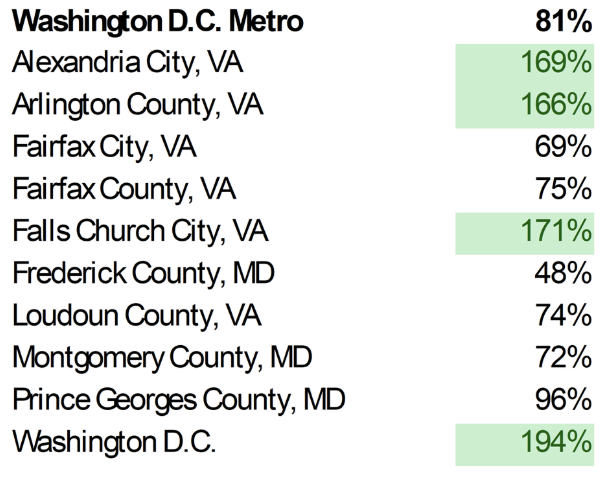
The urban area housing markets tend to have more inventory. In both Philadelphia and Washington, D.C., inventory is above pre-pandemic levels. In the close-in suburbs of Arlington and Alexandria, Virginia, inventory has also surpassed what was available to buyers in 2019.

There are many more local markets where inventory is still less than half of what was available in 2019. In most of the Philadelphia suburbs, for example, the number of active listings in May 2025 is less than 50% of May 2019 levels.

So, while more inventory is a welcome change for homebuyers in the marketplace, inventory is still relatively tight across much of the Mid-Atlantic region and sellers do still have the upper hand in the market.

read full Bright MLS article


How Trump’s Tariffs Are Reshaping Real Estate

As reported by The Real Deal — National Real Estate News
March 16, 2025
President Donald Trump’s second-term trade policies are shaking up the market in ways that landlords, developers and homebuyers can’t afford to ignore. From surging rents to stalled construction projects, the impact of tariffs is rippling through the industry. The uncertainty surrounding Trump’s tariffs and economic policies is pushing potential homebuyers to the sidelines, and that hesitation is driving rental prices to record highs

In New York City, Manhattan’s median rent hit a fresh high of $4,500 in February — its highest level since 2023. Brooklyn and Queens are feeling the pressure too, with Brooklyn rents averaging over $4,000 and Northwest Queens surpassing $3,400.

Chicago isn’t far behind. Downtown apartment rents just broke the $3,000 threshold for the first time ever, and with supply cratering due to high construction costs, developers are holding back — meaning rents are only expected to spike further in 2025.

Tenants are afraid to take the plunge into homeownership amid fluctuating mortgage rates and economic instability. The result is lower vacancy rates, more bidding wars and landlords with the upper hand. With summer around the corner, expect even higher rents in the months ahead.

While mortgage rates have dipped since Trump’s return to the White House, experts say the unpredictability surrounding his tariffs is outweighing any potential savings — causing some renters who once considered buying to think again.

The outlook for new homes isn’t any rosier, and homebuilders are scrambling. Trump’s tariffs on steel, aluminum and lumber imports are driving up costs, forcing builders to get creative. Some are stockpiling materials, gambling that today’s prices are better than what’s to come. Others are shrinking floor plans or pivoting to modular construction. The National Association of Home Builders estimates these tariffs could add $7,500 to $10,000 to the cost of a new home. And in places like California, where developers are already dealing with fire recovery costs, the added expense could mean the difference between rebuilding and walking away from projects altogether.

Politicians and pundits are pointing fingers at Commerce Secretary Howard Lutnick as the architect of Trump’s tariff strategy.

While Trump’s unpredictability has long been a hallmark of his economic policy, the former Cantor Fitzgerald head’s mixed messaging is keeping investors and industry players on edge.

In Texas, where industrial development has been booming, big players like Ross Perot Jr. are considering baking “tariff clauses” into contracts to prepare for rising costs. Meanwhile, Citadel founder Ken Griffin isn’t mincing words — calling Trump’s trade policies a “huge mistake” that could cripple the economy. Huge mistake or not, the uncertainty and chaos surrounding Trump’s tariffs is certainly making it difficult to stay ahead of the curve.

Jobs Market Still Healthy, but Uncertainty Drives Mortgage Rates Lower

Danielle Hale, Chief Economist for Realtor.com
March 7, 2025

Greater D.C. Area: Weekly Housing Market Update

Monitor the latest market activity in and around the nation’s capital with our experts’ week-by-week data breakdown. 
March 10,  2025 by Lisa Sturtevant, Phd

  • New listing activity rising seasonally in the D.C. region. The number of new listings coming on the market this past week is higher than last week, which is a typical seasonal trend. In the Washington D.C. region, new listings rose by 10.5% compared to last week. Across the overall Bright MLS service area, new listings were up 10.9% week-to-week. Early March tends to be the time of the year when prospective sellers are getting set to list in anticipation of the spring housing market.  
  • Listings are still relatively higher in the Washington D.C. region though it is still too early to tell the extent to which DOGE is impacting homeowners. A total of 2,050 new listings came onto the market across the greater Washington D.C. region last week, which was 20.5% higher than the same week a year ago. Listings were up just 14.3% year-over-year in the broader Bright MLS footprint. If D.C. area homeowners were selling because they were impacted by federal government layoffs or back-to-the office mandates, we will continue to see relatively higher listing activity in the region in the weeks to come. 
  • The Southern Maryland market may be one to watch. In Calvert County and Charles County in Maryland, new listing activity spiked this week. While it’s not possible to attribute this activity to federal government workforce changes, this market is one to watch. About one in five workers living in Calvert and Charles counties is a civilian federal government worker, according to data from the 2023 American Community Survey. In addition, these Southern Maryland communities attracted a lot of homebuying activity during the pandemic, including many workers who were able to work remotely at the time and may now be called back to the office. 
  • Buyers are still out in the Washington D.C. region. There were 1,600 new pending contracts on homes in the D.C. region last week, a 12.1% increase compared to a week ago. This is a stronger week-to-week gain than we see in the broader Bright MLS service area and is a testament to the on-going demand within the area’s housing market. Places with more listing activity—for example, Calvert and Charles counties—saw some of the strongest uptick in new pending contract activity, as buyers took advantage of the increased availability of homes for sale.

FHFA: U.S. House Prices Rose 4.5% in 2024

For Sale Sign in Front Yard of House - stock photo  Close-up of for sale rider on real estate sign post in front yard of house

Getty Images
February 25, 2025

Most states and metro areas saw home price growth last year. Prices increased more in areas with tighter inventory.

WASHINGTON – U.S. house prices rose 4.5% between the fourth quarter of 2023 and the fourth quarter of 2024, according to the Federal Housing Finance Agency House Price Index (FHFA HPI). House prices were up 1.4% compared to the third quarter of 2024. FHFA’s seasonally adjusted monthly index for December was up 0.4% from November.

“U.S. house prices grew at a slightly higher rate in the fourth quarter after three straight previous quarters of weaker appreciation,” said Dr. Anju Vajja, deputy director for FHFA’s Division of Research and Statistics. “The price growth accelerated during the quarter as the inventory of homes for sale tightened even further.”

Significant Findings

Nationally, the U.S. housing market has experienced positive annual appreciation each quarter since the start of 2012.

  • House prices rose in 49 states between the fourth quarter of 2023 and the fourth quarter of 2024. The five states with the highest annual appreciation were 1) Connecticut, 8.3%; 2) New Jersey, 8.3%; 3) Wyoming, 8.3%; 4) Vermont, 8.1%; and 5) Rhode Island, 7.6%. House prices declined in Mississippi by 0.2%.
  • House prices rose in 92 of the 100 largest metropolitan areas over the previous four quarters.  The annual price increase was the greatest in urban Honolulu, HI at 18.7%. The metropolitan area that experienced the most significant price decline was Cape Coral-Fort Myers, FL at 6.3%.
  • All nine census divisions had positive house price changes year-over-year. The Middle Atlantic division recorded the strongest appreciation, posting a 7.1% increase from the fourth quarter of 2023 to the fourth quarter of 2024. The West South Central division recorded the smallest four-quarter appreciation, at 2.3%.

The FHFA HPI is a comprehensive collection of publicly available house price indexes that measure changes in single-family home values based on data that extend back to the mid-1970s from all 50 states and over 400 American cities. It incorporates tens of millions of home sales and offers insights about house price changes at the national, census division, state, metro area, county, ZIP code and census tract levels. FHFA uses a fully transparent methodology based upon a weighted, repeat-sales statistical technique to analyze house price transaction data.

Source: Federal Housing Finance Agency


When Is the Perfect Time to Move?

couple with moving boxes

There’s no perfect time to buy a home – every market has trade-offs. If you’re ready and can afford it, lean on a pro to make the most of current trends.

NEW YORK — It’s easy to get caught up in the idea of waiting for the perfect moment to make your move — especially in today’s market. Maybe you’re holding out and hoping mortgage rates will drop, or that home prices will fall. But here’s what you need to realize: trying to time the market rarely works. And here’s why.

There is no perfect market

No matter when you buy, there’s always some benefit and some sort of trade-off — and that’s not a bad thing. That’s just the reality of it. If you’re not sure you buy into that, think back to the last five years in housing.

Just a few years ago, mortgage rates hit a historic low. To take advantage of that, a ton of buyers rushed to buy a home and lock in those lower rates. The side effect? With such a big increase in how many buyers were purchasing, the homes on the market were snapped up fast. And since that resulted in so few homes left for sale, bidding wars became the norm and home prices went through the roof. Those buyers got a great rate, but they had other things to contend with.

Now, with higher rates and higher prices, it’s more expensive to buy. You can’t argue that. But at the same time, the number of homes for sale is at the highest point in several years. That means you have more options to choose from and you’ll be less likely to find yourself in a pull-out-all-the-stops bidding war. Again, there are benefits and trade-offs in any market.

So, if you have a reason to move and can afford to do so, you’ve got to take advantage of the trends that work in your favor and lean on a pro to help you navigate the rest. As Bankrate says:

“The complexities of the current conditions mean that, now more than ever, it’s smart to lean on the guidance of an experienced local real estate agent. If you want to enter the housing market in 2025, whether as a buyer or a seller, let a pro lead the way for you.”

While achieving your goals may feel like an uphill battle in today’s complex market, it is doable. But you’ll need the help of a trusted real estate agent and a lender.

Your agent will help you explore creative solutions — like looking into different housing types (like smaller condos), considering homes that need a little elbow grease, or casting a wider net for your search area. And your lender will walk you through different loan options and down payment assistance programs, so you know what you need to do to make the numbers work for you. As Yahoo Finance says:

“Buying a house at a time when both mortgage rates and home prices are favorable is a challenge. You probably shouldn’t try to time the housing market … Buy when it makes sense for you personally.”

Bottom line

There’s no perfect time to move — every market has its pros and cons. The key is knowing how to make the most of the factors working in your favor. If you need to move and can afford to do it, let’s connect so you’ll have the guidance and tools to make it possible.

© Copyright Community Advocate 2025. All rights reserved.


Weekly Housing Trends

The U.S. presidential election and FOMC meeting dominated headlines last week, while the housing market hummed along, continuing recent trends. Home prices, inventory levels, market pace, and new listing activity all saw similar annual trends as the previous week. Mortgage rates climbed to their highest level since April in the week, and are expected to continue higher as a result of postelection Treasury yields. The Fed meeting resulted in the anticipated 25 basis-point rate cut as the FOMC continues to make decisions based on incoming economic data. The coming months could bring more mortgage rate volatility as reactions to the election and its implications move through the market.  

Over the past year, the housing market has remained largely unaffordable to many would-be buyers. However, veteran borrowers can take advantage of the many benefits of a VA mortgage loan. Compared with the typical conforming mortgage loan, VA loans have more flexible credit criteria and lower mortgage rates; they even allow eligible borrowers to put down a lower down payment. 

Key findings
The median listing price fell by 0.2% year over year

The median listing price fell for the third week in a row. Home prices have hovered within a few percentage points of the previous year’s level since spring 2023. It is the 24th week in a row that the median listing price in the U.S. is less than or equal to what it was in the corresponding week of 2023. However, when a change in the mix of inventory toward smaller homes is accounted for, the median listing price per square foot increased by 1.7% this week compared with the same time last year.  

New listings—a measure of sellers putting homes up for sale—climbed 1.7% this week compared with one year ago
The number of new listings on the market picked up compared with the same week last year. The recent upward trajectory of mortgage rates could largely discourage sellers from listing their homes as roughly 84% of outstanding mortgages have a rate of 6% or lower. Despite still-high rates, a recent read on home seller and buyer sentiment showed relatively rosy expectations. About 64% of sellers consider it a good time to sell, and just 22% of respondents expect mortgage rates to climb. Only time will tell whether the market will reflect this optimism. 

Active inventory increased, with for-sale homes 26.1% above year-ago levels
For the 53rd consecutive week, the number of listings for sale has grown year over year. This week’s growth was lower than last week’s, the seventh week of slowing growth, and the lowest annual change since late March. Slowing listing activity and stifled buyer demand have resulted in slowing inventory growth. Downward progress in mortgage rates could stoke buyer demand, which could eat into the recent buildup in active inventory. 

Homes spent 9 days more on the market compared with this time last year
The annual gap in time on the market increased to nine days this week, the biggest gap since July 2023. Generally, buyers have been holding off, waiting for more affordable housing conditions. However, with more options available, still-keen buyers might be feeling ready to act before winter. 

Mortgage Rates Ease, Ending 6-Week Climb

stacks of coins and a small house with a downward pointing arrow above. A hand is holding the arrow

November 14, 2024

Mortgage Rates Ease, Ending 6-Week Climb

By Alex Veiga

Rates on 30-year mortgages slipped to 6.78% from 6.79% last week. Borrowing costs on 15-year fixed-rate mortgages fell to 5.99% from 6%.

NEW YORK — The average rate on a 30-year mortgage in the U.S. edged lower this week, ending a six-week climb.

The rate slipped to 6.78% from 6.79% last week, mortgage buyer Freddie Mac said Thursday. That’s still down from a year ago, when the rate averaged 7.4%.

Borrowing costs on 15-year fixed-rate mortgages, popular with homeowners seeking to refinance their home loan to a lower rate, also eased this week. The average rate slipped to 5.99% from 6% last week. A year ago, it averaged 6.76%, Freddie Mac said.

Mortgage rates are influenced by several factors, including the yield on U.S. 10-year Treasury bonds, which lenders use as a guide to price home loans. Bond yields have been rising in recent weeks following encouraging reports on inflation and the economy.

Last week, bond yields surged on expectations that President-elect Donald Trump’s plans to lower tax rates, increase tariffs and reduce regulation could ultimately lead to higher U.S. government debt and inflation, along with faster economic growth.

The yield on the 10-year Treasury was at 4.41% at midday Thursday. It was at 3.62% as recently as mid-September.

Despite its recent upward move, the average rate on a 30-year mortgage is still down from 7.22% in May, its peak so far this year. In late September, the average rate got as low as 6.08% — its lowest level in two years.

Economists predict that mortgage rates will remain volatile this year, but generally forecast them to hover around 6% in 2025.

Elevated mortgage rates and high prices have helped keep the U.S. housing market in a sales slump going back to 2022.

Copyright 2024 The Associated Press. All rights reserved. This material may not be published, broadcast, rewritten or redistributed without permission.


Why Now’s Not the Time To Take Your House Off the Market

Has your house been sitting on the market longer than expected? If so, you’re bound to be frustrated by now. Maybe you’re even thinking it’s time to pull the listing and wait to see what 2025 brings. But what you may not realize is, the decision to hold off could actually cost you. Here’s a look at why staying the course could be the smarter move.

Other Sellers Are Pulling Back. Should You Hold Off Too?

According to recent data from Altos Research, the number of withdrawals is increasing – that means more sellers are opting to pull their listings off the market right now. And this isn’t unusual for this time of the year.

In the housing market, there are seasonal ebbs and flows. Inventory levels typically start to drop off a bit headed into the fall season as some sellers delay their plans until the new year. As Mike Simonsen, Founder of Altos Researchexplains:

“. . . we’re seeing a more normal seasonal pattern now with inventory beginning to decline. We’re also seeing more home sellers withdrawing their listings to try again next year. In fact, for every two sales, there is another listing withdrawn from the market.”

But is that a smart move? While it might seem like a good idea to pull your listing too, here’s why that approach may not pay off this year.

Today’s Buyers Are Serious and Ready To Act

The biggest reason to stick with your plan to sell now is that the buyers who are looking at this time of year are serious about making a purchase.

They’ve been sitting on the sidelines for a while waiting for affordability to improve. And now that mortgage rates are down from their recent peak, they’re ready to make their move. Mortgage applications are rising – and that’s a leading indicator that buyers are preparing to jump back in. And since they’ve already put their needs on the back burner for so long, they’re even more eager than buyers usually are at this time of year.

These aren’t window shoppers. They’re highly motivated buyers who want to move fast – and that’s the kind of buyer you want to work with. As Freddie Mac says:

“During the fall months, serious homebuyers are eager to settle in to a new home before the holiday season ramps up and the winter weather begins.”

By keeping your home on the market, you increase the chances of attracting people who are truly ready to make a purchase.

Bottom Line

While some sellers are choosing to take their homes off the market, this really isn’t the best move. With serious buyers eager to purchase, this is a great time to sell your house. Let’s connect to make sure we’ve got a strategy in place to make it happen. 


What Every Homeowner Should Know About Their Equity

Curious about selling your home? Understanding how much equity you have is the first step to unlocking what you can afford when you move. And since home prices rose so much over the past few years, most people have much more equity than they may realize.

Here’s a deeper look at what you need to know if you’re ready to cash in on your investment and put your equity toward your next home.

Home Equity: What Is It and How Much Do You Have?

Home equity is the difference between how much your house is worth and how much you still owe on your mortgage. For example, if your house is worth $400,000 and you only owe $200,000 on your mortgage, your equity would be $200,000.

Recent data from the Census and ATTOM shows Americans have significant equity right now. In fact, more than two out of three homeowners have either completely paid off their mortgages (shown in green in the chart below) or have at least 50% equity in their homes (shown in blue in the chart below):

Today, more homeowners are getting a larger return on their homeownership investments when they sell. And if you have that much equity, it can be a powerful force to fuel your next move.

What You Should Do Next

If you’re thinking about selling your house, it’s important to know how much equity you have, as well as what that means for your home sale and your potential earnings. The best way to get a clear picture is to work with your agent, while also talking to a tax professional or financial advisor. A team of experts can help you understand your specific situation and guide you forward.

Bottom Line

Home prices have gone up, which means your equity probably has too. Let’s connect so you can find out how much you have in your home and move forward confidently when you sell.


Nationally and some Florida Cities See Jump in Active Listings

new home owners receiving keys

courtneyk, iStock, Getty Images
MARCH 18, 2024

In Florida and nationwide, the housing supply is rebounding as sellers get used to elevated mortgage rates and the lock-in effect eases, Redfin found.

MIAMI – Active listings, or the total supply of homes for sale, in Cape Coral, North Port and Fort Lauderdale saw the biggest jump in the nation in February, the real estate brokerage firm Redfin reported. Nationwide, active listings climbed 0.8% from a month earlier on a seasonally adjusted basis and were little changed (-0.1%) from a year earlier — the smallest annual decline in months.

Nationally, new listings jumped 3.8% month over month on a seasonally adjusted basis in February to the highest level since September 2022. They were up 14.8% year over year, the largest annual gain since May 2021. In Florida, condo listings were the driving force contributing to the jump in supply amid a surge in HOA and insurance fees.

“The housing market is nothing like it was two years ago during the pandemic homebuying frenzy, but it’s better than it was last year. It’s coming back,” said David Palmer, a Redfin agent in Seattle. “Sellers who were on the fence in 2023 are now listing. They’re more used to elevated rates now. There still aren’t enough listings to quench pent-up buyer demand, but it’s getting better.”

Nationwide, housing supply is on the rise because the “lock-in effect” is easing; eventually, homeowners who have been holding on to their ultra-low mortgage rates simply have to move.

“February was a mixed bag for the housing market and the economy,” said Redfin Economics Research Lead Chen Zhao. “Housing supply is finally starting to recover in a meaningful way, which is great news for buyers who for months have been competing for a tiny pool of homes for sale. Still, many house hunters are hesitant to pull the trigger because mortgage rates and home prices remain elevated.”

Mortgage-purchase applications slid in February as mortgage rates ticked back up after dropping in December. The average 30-year-fixed mortgage rate was 6.78% in February up from 6.64% in January.

At the same time, prices continue to rise because, despite the recent uptick in listings, there’s still not enough supply to meet demand, Redfin said. Both new listings and active listings remained far below pre-pandemic levels in February.

“If you price your home reasonably, buyers will show up. If you don’t, buyers will wait for you to drop the price,” Palmer said. “I recently listed an estate sale fixer upper for $550,000 and it got 14 offers, sold for $75,000 over the asking price and the buyer waived every contingency.”

read full article

© 2024 Florida Realtors®