Week of March 10th Weekly Real Estate Update

Key Findings:

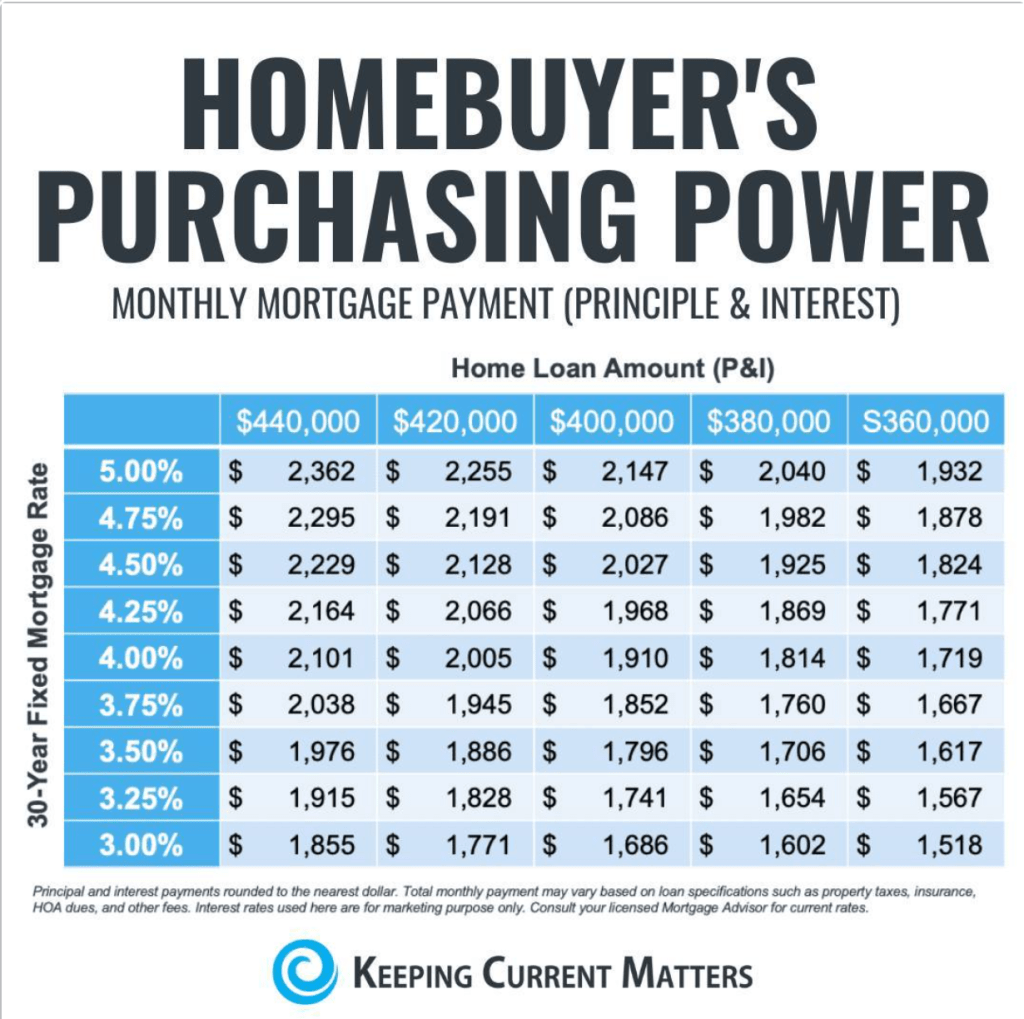
  • The median listing price grew by 6.3% over last year. Growth in the typical asking price of for-sale homes moved lower after a slight uptick last week’s pace, once again hitting a new low since June 2020, when the housing market was beginning to bounce back from the initial pandemic shock. While the housing market had shown some signs of stabilizing, a renewed climb in mortgage rates could undermine the recovery. With the Fed signaling that higher rates for longer may be necessary to tame inflation, all eyes are focused on their March statement and clues on how their view of the future has evolved. 
  • New listings–a measure of sellers putting homes up for sale–were again down, this week by 26% from one year ago. For 35 weeks now, fewer homeowners put their homes on the market for sale than at this time one year ago. Until this week, the gap was slightly smaller than we saw in the last quarter of 2022. In February, attitudes toward housing worsened among both potential buyers and potential sellers as mortgage rates began to climb again and respondents reported lower job security. These attitudes could mean ongoing weakness in the number of homeowners deciding to sell. 
  • Active inventory growth continued to climb with for-sale homes up 61% above one year ago. Inventories of for-sale homes rose again, but the gain was the lowest we’ve seen since December. With new listings lagging behind year-ago pace, the growing number of homes for sale reflects longer time on market rather than an influx of sellers. It’s also important to remember that this year over year comparison is relative to early 2022, when active listings were at or near long-term lows. Even after these huge year over year gains, February data show that nationwide there are only just more than half as many homes for sale as were available pre-pandemic (-47%). 
  • Homes spent 18 extra days on the market compared to this time last year. For 31 weeks, homes on the market have been for-sale longer than was typical one year ago. After rising steadily from summer 2022, the gap surged early in 2023, surpassing the 3 week mark in mid-February. This week, however, marks the third week that the gap has shrunk even as new listings remain scarce, suggesting that buyers are active in the market, even if they are not as numerous as this time last year. Our February Housing Trends Report helps put these changes into context. Even though the median home listing was on the market for 67 days, 23 days longer than this time last year, this still trailed the pre-pandemic average for February by a nearly equal amount (20 days). In other words, using time on market as a guide, today’s housing market is halfway between its most frenetic period one year ago and what was typical before the pandemic-era frenzy. This means that the market has room to adjust in either direction, and mortgage rates will likely play a strong role in determining whether the market slows further or picks up speed.

NAR: ‘Home Sales Are Bottoming Out’

February 21, 2023 By: Melissa Dittmann Tracey

Spring is around the corner, and the signs are pointing to a pick-up in sales on the horizon. Read more from NAR’s latest housing report.

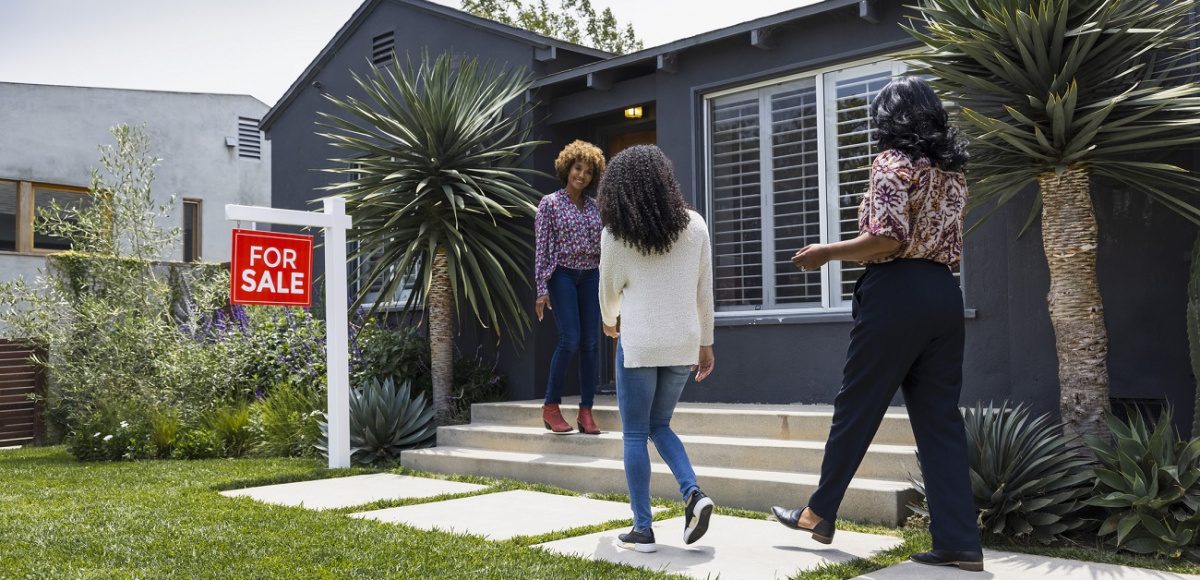
saleswoman greeting female customers while standing outside house

Existing-home sales continued to ease in January, marking a yearlong stretch of declines coming off pandemic-fueled highs. But median home prices still are rising.

Total existing-home sales—completed transactions that include single-family homes, townhomes, condos and co-ops—decreased 0.7% in January compared to December 2022, the National Association of REALTORS® reported Tuesday. Home sales are down nearly 37% compared to a year earlier (at a seasonally adjusted annual rate of 4 million in January).

But as mortgage rates begin to stabilize, economists are hopeful for a turnaround in sales activity for the housing market heading into spring.

“Home sales are bottoming out,” says Lawrence Yun, NAR’s chief economist. “Prices vary depending on a market’s affordability, with lower-priced regions witnessing modest growth and more expensive regions experiencing declines.”

Overall, the median existing-home sales price nationwide rose 1.3% compared to a year ago, reaching $359,000, NAR reports. Home prices climbed in three out of the four major regions of the U.S., only falling in the West last month.  

The supply of homes for sale continues to be tight in most markets across the country, helping to keep home prices higher. Still, total housing inventory rose 2.1% in January month-over-month and is up by 15.3% compared to a year ago. Unsold inventory, remains, at a brisk, 2.9-month supply at the current sales pace.

“Inventory remains low, but buyers are beginning to have better negotiating power,” Yun says. “Homes sitting on the market for more than 60 days can be purchased for around 10% less than the original list price.”

Here’s a closer look at other key indicators from NAR’s latest housing report:
Days on the market: Fifty-four percent of homes sold in January were on the market for less than a month in January. On average, properties remained on the market for 33 days in January, up from 26 days in December and 19 days a year earlier.
First-time home buyers: As competition lessens, first-time home buyers are re-emerging. First-time buyers accounted for 31% of sales in January, up from 27% a year earlier.
All-cash sales: All-cash transactions comprised 29% of sales in January, up from 27% in January 2022. Individual investors and second-home buyers tend to make up the biggest bulk of all-cash sales. They purchased 16% of homes in January, down from 22% a year earlier.
Distressed sales: Foreclosures and short sales continue to make up a very small share of sales. Distressed sales accounted for 1% of sales in January, matching levels from a year earlier.
 
Regional Snapshot
Here’s how existing-home sales fared across the country in January:

  • Northeast: Existing-home sales fell 3.8% from December, reaching an annual rate of 500,000 in January. Sales were down nearly 36% from a year earlier. Median price: $383,000, up 0.3% from January 2022
  • Midwest: Sales decreased 5% compared to the previous month, reaching an annual rate of 960,000 in January. Sales were down 33.3% from one year ago. Median price: $252,300, up 2.7% from January 2022
  • South: Sales rose 1.1% in January compared to December, reaching an annual rate of 1.82 million. Sales are down nearly 37% from the prior year. Median price: $332,500, an increase of 3.4% from one year ago
  • West: Existing-home sales increased 2.9% in January, reaching an annual rate of 720,000, but still down 42.4% from the previous year. Median price: $525,200, down 4.6% from January 2022

Weekly Housing Market Update -2/17/2023

This week, Chief Economist Danielle Hale discusses what small business optimism, consumer and producer inflation data, and retail sales data signal about the U.S. economy. She also highlights what these data imply for the Fed’s likely path forward.

0:10 – Business optimism trends
0:25 – Inflation trends
1:24 – Mortgage rates
1:40 – Construction trends
2:11 – Real estate listings trends


3 wooden homes, a pile of money and an FHA loan sign

Andrii Yalanskyi, Getty Images

DECEMBER 2, 2022

FHA Announces 2023 Loan Floors and Ceilings

By Kerry Smith

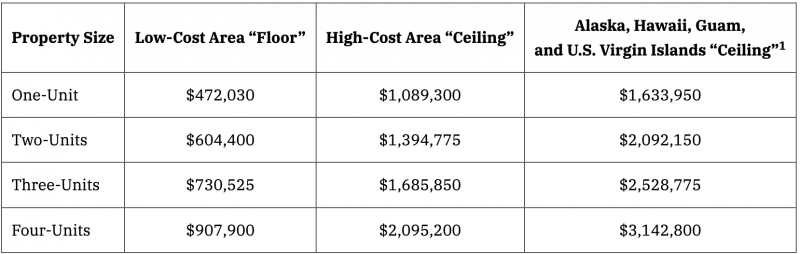
Loans for single units range from $472,030, the floor, to $1,089,300, the ceiling. For four units, it’s $907,000 to over $2M – and in some non-Fla. areas, over $3M.

WASHINGTON – The Federal Housing Administration (FHA) announced new loan limits for calendar year 2023 for its Single Family Title II forward and Home Equity Conversion Mortgage (HECM) insurance programs.

For most of the country, loan limits will increase next year due to house price appreciation during the first half of 2022, which is factored into calculations FHA uses to determine the limits each year. The yearly increase calculations for FHA loans and those backed by Fannie Mae and Freddie Mac are written into law.

“The loan limits announced today reflect steep increases in home prices throughout much of the country and will ensure continued access to FHA-insured mortgage financing despite those increases,” said Assistant Secretary for Housing and Federal Housing Commissioner Julia Gordon.

Forward mortgage loan limits

Range of prices for 2023 FHA loans based on location and number of units

Mortgage limits for the special exception areas of Alaska, Hawaii, Guam, and the U.S. Virgin Islands are adjusted by FHA to account for higher costs of construction.

In 2023 the maximum loan limits for FHA forward mortgages will rise in 3,222 counties. In 12 counties, FHA’s loan limits will remain unchanged. By statute, the median home price for a Metropolitan Statistical Area (MSA) is based on the county within the MSA that has the highest median price.

HECM loan limits

The HECM maximum claim amount will increase from $970,800 this year to $1,089,300 for FHA case numbers assigned on or after Jan. 1, 2023. This maximum claim amount is applicable to all areas, including the special exception areas of Alaska, Hawaii, Guam, and the U.S. Virgin Islands.

To find a complete list of FHA loan limits, areas at the FHA ceiling, and areas between the floor and the ceiling, visit FHA’s Loan Limits Page.

© 2022 Florida Realtors®


NAR: 3Q Home Prices Up in 98% of Metros

By Kerry Smith -NOVEMBER 11, 2022

Home prices rose 8.6% in 3Q, with 46% of metros seeing double-digit price growth – a drop from 80% in 2Q. Of the top 10 high-price-increase metros, 7 are in Fla.

WASHINGTON – An overwhelming majority of metro markets saw home price gains in the third quarter of 2022, according to the National Association of Realtors® (NAR). That increase was in spite of rising mortgage rates that approached 7% and declining sales.

Of the 185 metros NAR tracks, 46% had double-digit price increases, though that’s down from 80% in the second quarter.

The national median single-family existing-home price climbed 8.6% year-to-year to $398,500. While still a notable price increase, it’s down from the 14.2% recorded in the previous quarter.

“Much lower buying capacity has slowed home price growth and the trend will continue until mortgage rates stop rising,” says NAR Chief Economist Lawrence Yun. “The median income needed to buy a typical home has risen to $88,300 – that’s almost $40,000 more than it was prior to the start of the pandemic back in 2019.”

Among the major U.S. regions, the South registered the largest share of single-family existing-home sales (44%) and the greatest year-over-year price appreciation (11.9%) in the third quarter. Prices were up 8.2% in the Northeast, 7.4% in the West, and 6.6% in the Midwest.

Fla. has 7 of top 10 metros for price growth

  1. North Port-Sarasota-Bradenton – 23.8%
  2. Lakeland-Winter Haven – 21.2%
  3. Myrtle Beach-Conway-North Myrtle Beach, S.C.-N.C. – 21.1%
  4. Panama City – 20.5%
  5. Deltona-Daytona Beach-Ormond Beach – 19.6%
  6. Port St. Lucie – 19.4%
  7. Greenville-Anderson-Mauldin, S.C. – 18.9%
  8. Kingsport-Bristol-Bristol, Tenn.-Va. – 18.8%
  9. Tampa-St. Petersburg-Clearwater – 18.8%
  10. Ocala (18.8%

10 most expensive markets in the U.S.

  1. San Jose-Sunnyvale-Santa Clara, Calif. – $1,688,000; 2.3%
  2. San Francisco-Oakland-Hayward, Calif. – $1,300,000; -3.7%
  3. Anaheim-Santa Ana-Irvine, Calif. – $1,200,000; 9.1%
  4. Urban Honolulu, Hawaii – $1,127,400; 7.6%
  5. San Diego-Carlsbad, Calif. – $900,000; 5.9%
  6. Los Angeles-Long Beach-Glendale, Calif. – $893,200; 3.8%
  7. Boulder, Colo. – $826,900; 7.5%
  8. Naples-Immokalee-Marco Island – $746,600; 16.7%
  9. Seattle-Tacoma-Bellevue, Wash. – $741,300; 4.6%
  10. Boston-Cambridge-Newton, Mass.-N.H. – $698,900; 6.2%

“The more expensive markets on the West Coast will likely experience some price declines following this rapid price appreciation, which is the result of many years of limited home building,” Yun says. “The Midwest, with relatively affordable home prices, will likely continue to see price gains as incomes and rents both rise.”

Higher cost for monthly payments

In the third quarter of 2022, stubbornly high home prices and increasing mortgage rates reduced housing affordability. The monthly mortgage payment on a typical existing single-family home with a 20% down payment was $1,840. That’s a marginal increase from the second quarter ($1,837) but a significant year-to-year jump of $614 – or 50%.

Families typically spent 25% of their income on mortgage payments, down from 25.3% in the prior quarter, but up from 17.2% one year ago.

“A return to a normal spread between the government borrowing rate and the home purchase borrowing rate will bring the 30-year mortgage rates down to around 6%,” Yun says. “The usual spread between the 10-year Treasury yield and the 30-year mortgage rate is between 150 to 200 basis points, rather than the current spread of 300 basis points.”

First-time buyer challenges

First-time buyers looking to purchase a typical home during the third quarter of 2022 continued to feel the impact of housing’s growing unaffordability. For a typical starter home valued at $338,700 with a 10% down payment loan, the monthly mortgage payment rose to $1,808 – nearly identical to the previous quarter ($1,807) but an increase of almost $600 (49%), from one year ago ($1,210).

First-time buyers typically spent 37.8% of their family income on mortgage payments, up from 36.8% in the previous quarter. A mortgage is considered unaffordable if the monthly payment (principal and interest) amounts to more than 25% of the family’s income.

A family needed a qualifying income of at least $100,000 to afford a 10% down payment mortgage in 59 markets, up from 53 in the prior quarter. Yet, a family needed a qualifying income of less than $50,000 to afford a home in 17 markets, down from 23 in the previous quarter.

© 2022 Florida Realtors®


Calendar with bill due dates circled, including on that says pay rent

OCTOBER 6, 2022

Fannie Mae Joins Freddie, FHA to Use Rent Payments

By Talis Shelbourne

A majority of mortgage providers will now allow renters with thin credit scores to include on-time rent payments in the data a lender uses when considering approvals.

WASHINGTON – Fannie Mae launched its Multifamily Positive Rent Payment Reporting pilot program last week, offering a national lifeline to aspiring homeowners with no established credit history.

The program is expected to have a significant impact on cities with high renter populations and on groups that often have difficulty establishing credit.

Fannie Mae, officially the Federal National Mortgage Association, was created by Congress during the Great Depression. The public-private “government-supported enterprise” purchases mortgages from financial institutions.

Fannie Mae had already updated its computer-automated system last year to include bank records showing consistent rent payments by individuals. The system, called the Desktop Underwriter, is used by lenders to evaluate the creditworthiness of mortgage applicants.

The change meant individuals could collect documentation of their rent payments made via check, electronically through a rental management’s payment portal and through other electronic methods connected to a bank and provide those to a mortgage lender as evidence of a good rental history. Freddie Mac and FHA loans previously announced rent-payment considerations.

This latest rent reporting program allows the renters of multifamily properties to report their rent payment history. As an incentive, Fannie Mae will cover the first year of costs associated with reporting that data.

According to Fannie Mae, if a renter misses a payment, they are automatically unenrolled so it does not damage their credit score; landlords, however, are allowed to report missed rent payments to credit agencies on their own, which would negatively impact credit history.

Credit is an essential part of the home buying process, and experts advise prospective homeowners achieve a credit score of at least 620 to get the best rates for a mortgage.

The lender ultimately decides to approve the loan. In some cases, Fannie Mae will purchase a loan to “guarantee” it, which means it is responsible for the debt if the borrower defaults.

© 2022 Journal Media Group.


Scott Bradley Brixen – ListReports Blog

Real Estate News

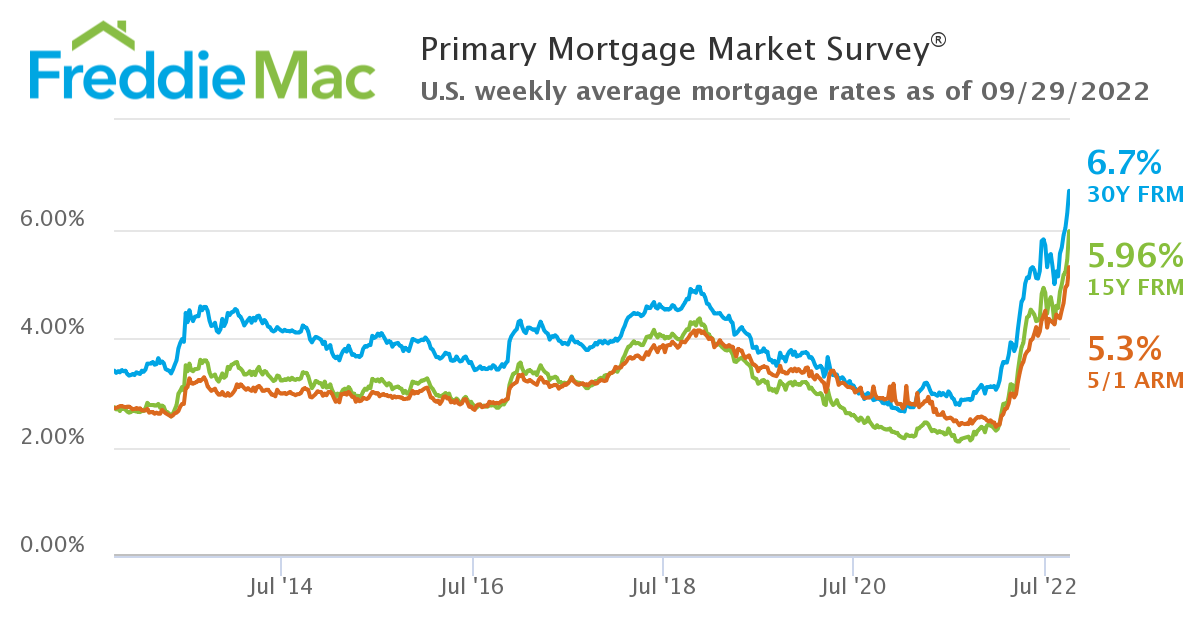
Interest rates for the average 30-yr, fixed-rate mortgage according to Freddie Mac’s PMMS hit:

4% in March 😟
5% in April 😰
6% in early-September 😨
7% (well, almost) in late-September 😱

The slowdown continues, but we have yet to see the impact of the most recent (massive) jump in mortgage rates on homebuyer demand.

August existing home sales dropped for the 7th straight month. Price growth decelerated further to “just” 8% YoY. [Source: Realtor.com]

Meanwhile, pending sales for August dropped 2% MoM and 24% YoY. The NAR now forecasts existing home sales to fall 15% YoY in 2022, with new home sales down 21% YoY. [Source: NAR]

Case-Shiller Index

Home price growth slowed to 15.8% YoY in July, from 18.1% YoY in June. That may not seem like much, but it’s the biggest 1-month drop in the index’s history.

Case-Shiller is the gold standard for home price appreciation because it tracks the sales prices of very similar homes across 20 big cities. It’s an ‘apples to apples’ comparison. But that accuracy comes at a cost…the data is 2 months old by the time we get it.

Mortgage Market

An extremely volatile week for the bond market (after the Fed raised rates 75bps) saw 30-year, fixed-rate mortgages briefly exceed 7% [with no points], before dropping back to around 6.75%. [Source: Mortgage News Daily]

Freddie Mac’s closely watched PMMS survey saw the interest rate on the average 30-year, fixed-rate mortgage climb to 6.7%. Keep in mind that this figure includes an average 0.9 points purchased. Without those points, the rate would have been at/ahead of 7%.

Still a Seller’s Market

Demand is falling and inventory has risen, but in most markets, well-priced homes are still selling very, very quickly.

In fact, the average Days on Market for sold properties has only edged up from 14 (in June & July) to 16 in August. In 2011 that figure was 96! Looked at another way, 81% of homes sold in August had been on the market less than a month.

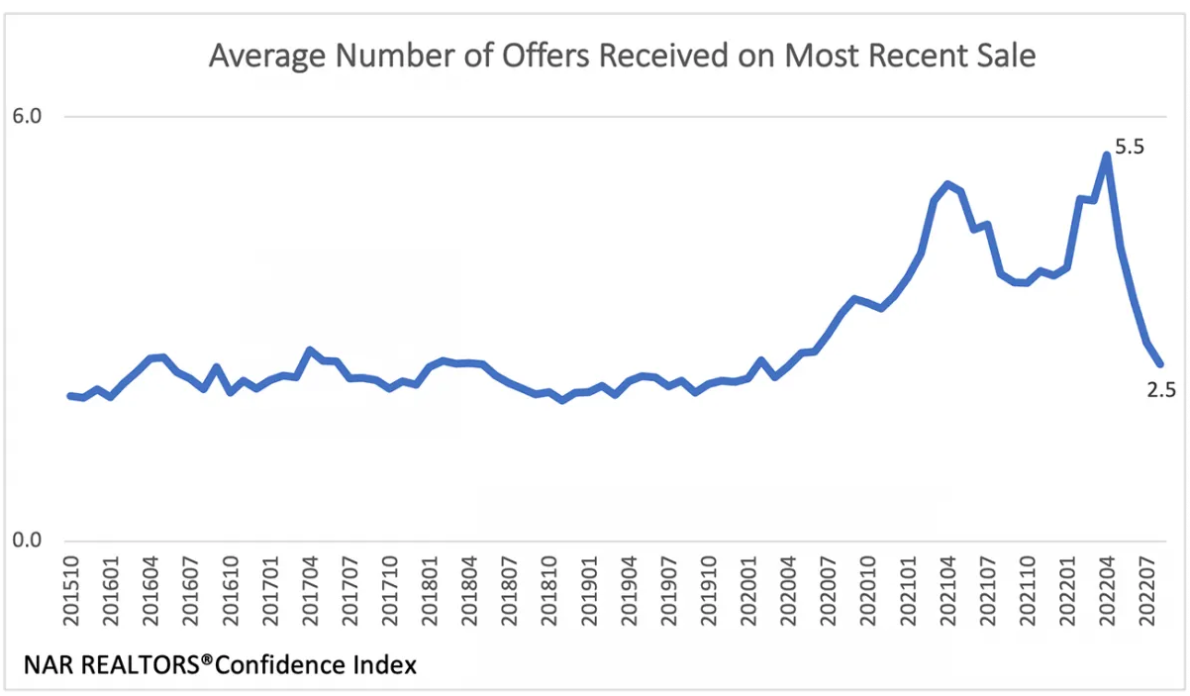
That said, the average number of offers received for each property sold has plunged from a frenzied 5.5 in April 2022 to 2.5 in August. That’s actually getting pretty close to “normal” pre-pandemic levels of competition.

National Housing Stats

They Said It

“Success demands singleness of purpose. You need to be doing fewer things for more effect instead of doing more things with side effects. It is those who concentrate on one thing at a time who advance in this world.” — Gary Keller, The One Thing

“Our house is clean enough to be healthy and dirty enough to be happy” — Robyn Griggs Lawrence

Inspiration

The average duration of homeownership in the US is around 12 years. So if someone in your sphere of influence (SOI) bought a home in the last few years, there’s no reason to actively stay in touch with them, right? Wrong. Take the inverse of 12 (that’s 1/12) and you get 8.3%.

This means that, mathematically, 8% of your SOI is going to move in the next year…for reasons that you (and often they) couldn’t have predicted. Hockey legend Wayne Gretzky said “you miss 100% of the shots you don’t take.” In real estate, you probably lose 80–90% of the past clients that you don’t stay in contact with.


August 2022 Monthly Housing Market Trends Report


Sabrina Speianu, Economic Data Manager, realtor.com®

  • The national inventory of active listings increased by 26.6% over last year. 
  • The total inventory of unsold homes, including pending listings, increased by just 1.3% year-over-year due to a decline in pending inventory (-21.9%). 
  • Selling sentiment declined and listing activity followed, with newly listed homes declining by 13.4% on a year-over-year basis.
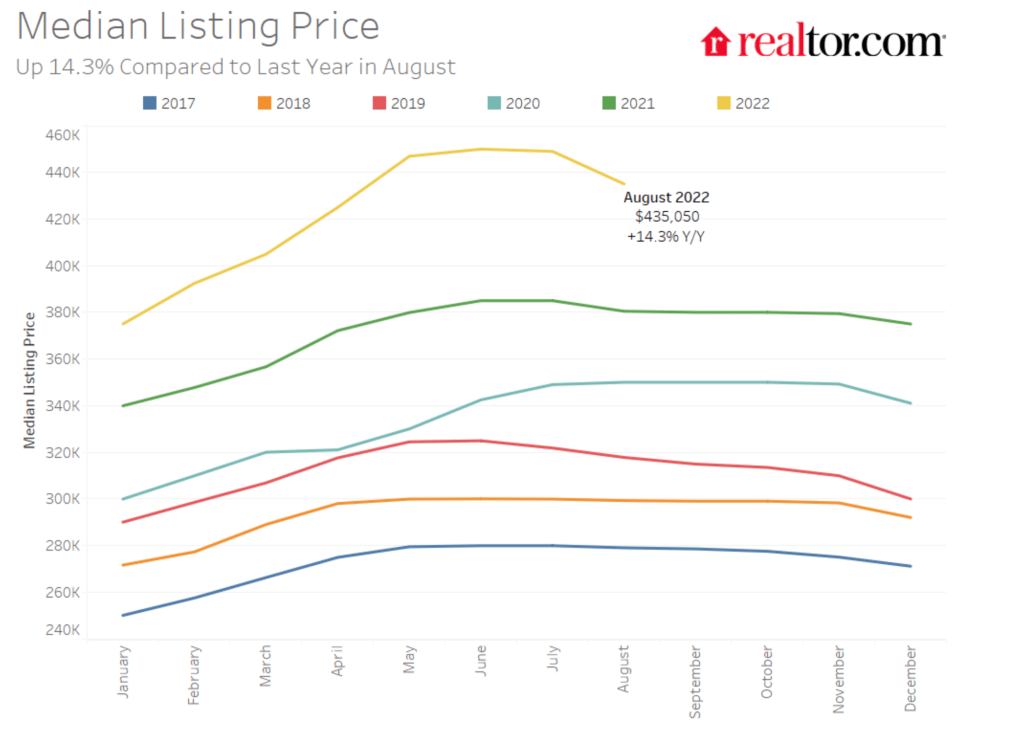
  • The median list price grew by 14.3% in August, a deceleration from recent highs.
  • Time on market was 42 days, 5 days more than last year but 22 days less than typical pre-pandemic levels.
  • Regionally, large Western markets which saw some of the most growth last year and earlier this year are now showing the greatest signs of deceleration, with larger inventory increases, more price reductions, and more quickly decelerating price growth than other regions. 

Read the FULL article


NAR: Feb. Existing-Home Sales Drop 7.2%

By Kerry Smith

Year-to-year, sales declined 2.4%. NAR’s chief economist calls it a “double whammy” for buyers who face rising mortgage rates and sustained price increases.

WASHINGTON – U.S. existing-home sales dipped in February, continuing a seesawing pattern of gains and declines over the last few months, according to the National Association of Realtors® (NAR).

Each of the four major U.S. regions tracked in NAR’s monthly survey saw sales fall on a month-over-month basis. While sales activity year-over-year was also down overall, the South – the region that includes Florida – saw an increase while the remaining three regions reported drops.

Total existing-home sales – completed transactions that include single-family homes, townhomes, condominiums and co-ops – sank 7.2% from January to a seasonally adjusted annual rate of 6.02 million in February. Year-over-year, sales decreased 2.4% (6.17 million in February 2021).

“Housing affordability continues to be a major challenge as buyers are getting a double whammy: rising mortgage rates and sustained price increases,” says Lawrence Yun, NAR’s chief economist. “Some who had previously qualified at a 3% mortgage rate are no longer able to buy at the 4% rate.

“Monthly payments have risen by 28% from one year ago – which interestingly is not a part of the consumer price index – and the market remains swift with multiple offers still being recorded on most properties.”

Total housing inventory at the end of February totaled 870,000 units, up 2.4% from January and down 15.5% from one year ago (1.03 million). Unsold inventory sits at a 1.7-month supply at the current sales pace, up from the record-low supply in January of 1.6 months, but down from 2.0 months in February 2021.

“The sharp jump in mortgage rates and increasing inflation is taking a heavy toll on consumers’ savings,” Yun says. “However, I expect the pace of price appreciation to slow as demand cools and as supply improves somewhat due to more home construction.”

The median existing-home price for all housing types in February was $357,300, up 15.0% from February 2021 ($310,600), with prices higher in all four regions. It’s the 120th consecutive months for year-over-year increases – the longest-running streak on record.

Properties typically remained on the market for 18 days in February, down from 19 days in January and 20 days in February 2021, with 84% of February homes on the market for less than a month.

First-time buyers made up 29% of February sales, an increase from 27% in January, though down from 31% in February 2021.

Individual investors or second-home buyers, who make up many cash sales, purchased 19% of homes in February, down from 22% in January and up from 17% in February 2021. All-cash sales accounted for 25% of transactions in February, down from 27% in January and up from 22% in February 2021.

Distressed sales – foreclosures and short sales – represented less than 1% of sales in February, equal to the percentage seen both month-to-month and year-to-year.

According to Freddie Mac, the average commitment rate for a 30-year, conventional, fixed-rate mortgage was 3.76% in February, up from 3.45% in January. The average commitment rate across all of 2021 was 2.96%.

Single-family and condo/co-op sales: Single-family home sales jumped to a seasonally adjusted annual rate of 5.35 million in February, down 7.0% month-to-month and down 2.2% year-to-year. The median existing single-family home price was $363,800 in February, up 15.5% from February 2021.

Existing condominium and co-op sales were recorded at a seasonally adjusted annual rate of 670,000 units in February, down 9.5% from 740,000 in January and down 4.3% from one year ago. The median existing condo price was $305,400 in February, an annual increase of 10.9%.

“For the past couple of years, buyers have had to contend with a market of high demand, low inventory and a mix of uncertainties with COVID-19 protocols,” says NAR President Leslie Rouda Smith. “Consumers are presently challenged with higher mortgage rates, so now, more than ever, interested buyers need the trusted expertise of Realtors in order to navigate this current market.”

Regional breakdown: Existing-home sales in the Northeast slipped 11.5% in February, registering an annual rate of 690,000 – a 12.7% drop from February 2021. The median price in the Northeast was $383,700, up 7.1% from one year ago.

Existing-home sales in the Midwest sagged 11.3% from the prior month to an annual rate of 1,330,000 in February, a 1.5% decrease from February 2021. The median price in the Midwest was $248,900, a 7.5% climb from February 2021.

Existing-home sales in the South fell 5.1% in February month-to-month, posting an annual rate of 2,790,000 – which was an increase of 3.0% compared to February 2021. The median price in the South was $318,800, an 18.1% jump from one year earlier.

For the sixth straight month, the South experienced the highest pace of price appreciation compared to the other regions.

“Employment is vital for housing demand,” said Yun. “The Southern states are seeing faster job growth, and consequently, it’s the only region to experience a sales gain from a year ago.”

Existing-home sales in the West slid 4.7% from the previous month, reporting an annual rate of 1,210,000 in February, down 8.3% from one year ago. The median price in the West was $512,600, up 7.1% from February 2021.


The Federal Reserve Is Ready To Raise Interest Rates Soon Despite The War In Ukraine

SCOTT HORSLEY Twitter LISTEN· 4:10
Heard on All Things Considered

Federal Reserve Chair Jerome Powell testifies about monetary policy and the state of the economy before the House Financial Services Committee on Wednesday. Powell reiterated the Fed is gearing up to raise interest rates this month.

Federal Reserve Chair Jerome Powell said on Wednesday the central bank is on track to start raising interest rates this month — likely by a quarter percentage point — in an effort to combat inflation, which is the highest it’s been in nearly 40 years.

But the Fed will proceed with caution, Powell told the House Financial Services Committee, as Russia’s invasion of Ukraine adds more uncertainty to the economic outlook.

“The economics of these events are highly uncertain,” Powell said. “So far, we’ve seen energy prices move up further and those increases will move through the economy and push up headline inflation, and also they’re going to weigh on spending.”

The average price of gasoline in the U.S. approached $3.66 per gallon on Wednesday. Rising energy prices have been a significant driver of annual inflation, which hit 7.5% in January – the highest level since 1982.

Powell says it’s too soon to tell on Ukraine

Powell said it’s too soon to know how large or long-lasting price increases tied to events in Ukraine will be, so he and his colleagues on the central bank’s rate-setting committee are prepared to be flexible.

“We’re never on auto-pilot,” Powell said. “Those of us on the committee have an expectation that inflation will peak and begin to come down this year. And to the extent that inflation comes in higher or is more persistently high than that, then we would be prepared move more aggressively.”

Forecasters expect the Fed to impose additional interest rate hikes later this year in an effort to cool red-hot consumer demand, which has outstripped supply and driven prices sharply higher.


read the NPR full article