
Will Home Prices and Rents Finally Fall? Our Bold Predictions on Real Estate in 2022

By Clare Trapasso
Dec 1, 2021

1 of a 3 part series
Highlights:

  • Prices will stay high, inventory will remain tight, and mortgage rates will rise
  • Prices aren’t anticipated to come down from the highs
  • “The pace of price growth is going to slow notably, bringing it more in line with buyers’ incomes”

Here’s what we already know: Since the COVID-19 pandemic began, the real estate market has been on a wild ride of unprecedented highs and lows—record-high home prices on one side, record-low mortgage rates and available homes for sale on the other. It’s been a time of overwhelming stress for many, gigantic profits for some, and great disorientation for most of us.

Now the housing experts say the market is “normalizing.” But what does that mean? Will home prices and rents finally come down? Will more homes go up for sale? And what does the year ahead have in store for the real estate market?

The Realtor.com® 2022 housing forecast anticipates the market will continue slowing down from the frenzy seen in the spring when prices shot up to new heights. However, prices will stay high, inventory will remain tight, and mortgage rates will rise.

The bottom line: Even as the market calms down further, it’s still expected to be challenging for buyers, especially those purchasing their first homes.

“The 2022 housing market will continue to be a seller’s market with fast-moving homes and rising prices,” says Realtor.com Chief Economist Danielle Hale. “But the competition should be a bit less intense than we’ve seen recently.”

Home prices will stay high, but price growth will continue slowing

Home prices aren’t expected to keep zooming up into the stratosphere in 2022 the way they did this year. So buyers can breathe at least a shallow sigh of relief. Instead, Realtor.com economists anticipate they’ll increase at a much slower rate of just 2.9% over this year compared with an anticipated 12% rise in 2021.

This means the double-digit price growth that confounded buyers earlier this year is expected to taper off.

However, prices aren’t anticipated to come down from the highs they reached this year due to the continuing shortage of properties for sale and hordes of buyers continuing to enter the market. They just won’t go up so much as quickly.

“Price growth is expected to move back toward a normal range, but this is on top of recent high prices,” says Hale. “So prices will [still] hit new highs.”

While that’s not great news for buyers, homes aren’t expected to cost much more than they did just a few months ago.

“The pace of price growth is going to slow notably, bringing it more in line with buyers’ incomes,” says Hale. “With prices high and mortgage rates beginning to tick up, people won’t be able to be as aggressive in what they’re willing to pay.”
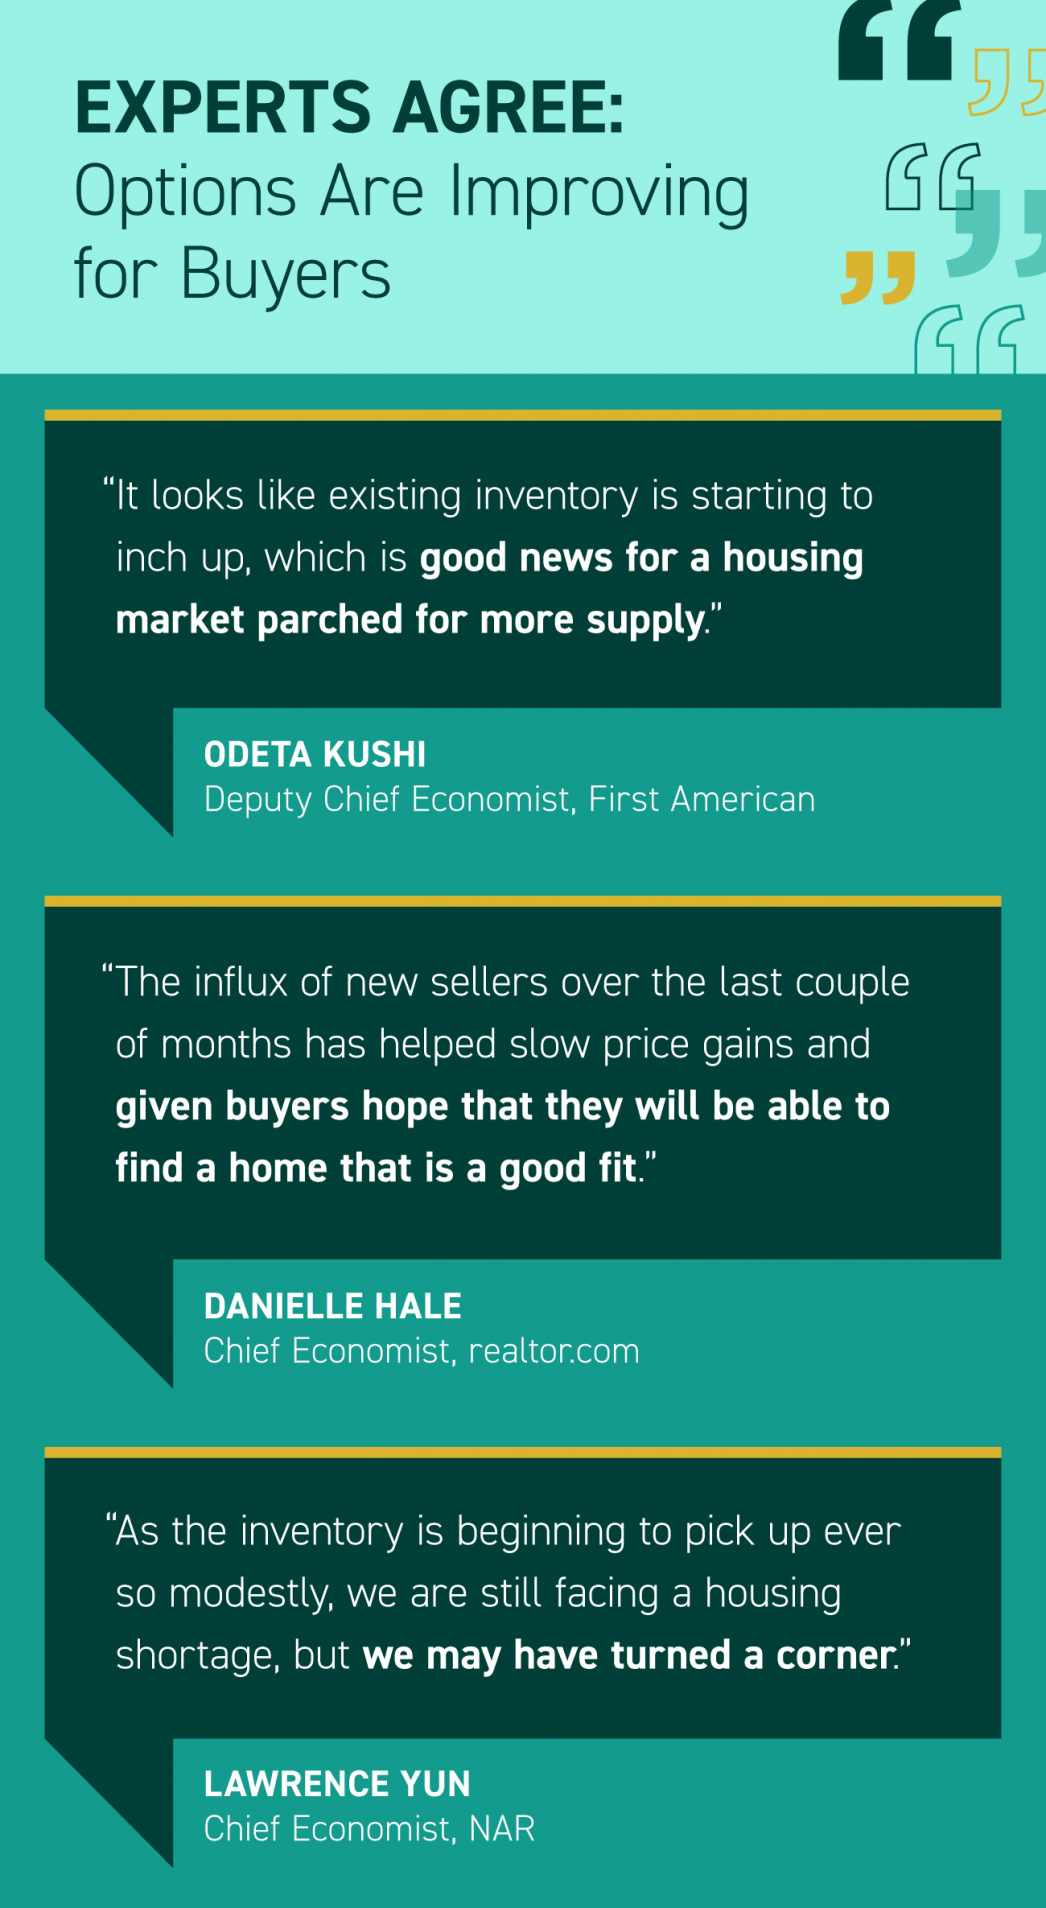

Experts Agree: Options Are Improving for Buyers

Experts Agree: Options Are Improving for Buyers [INFOGRAPHIC] | MyKCM

Some Highlights

  • Buyers hoping for more homes to choose from may be in luck as housing inventory begins to rise. Many experts agree – new sellers listing their homes is great news for buyers and the overall market.
  • Although the supply increases are modest, more homes means more options for buyers. A rise in inventory may also help slow the price gains we’ve seen recently and could be a sign of good things to come.
  • If you’re searching for a home, rising inventory is welcome news. Let’s connect today to discuss new listings in our area.

U.S. Homeowners Enjoyed $1.9 Trillion of Equity Gains in Early 2021

CoreLogic’s newly released Homeowner Equity Report for the first quarter of 2021 shows U.S. homeowners with mortgages (which account for roughly 62% of all properties) have seen their equity increase by 19.6% year over year, representing a collective equity gain of over $1.9 trillion, and an average gain of $33,400 per borrower, since the first quarter of 2020.

Residential News » Irvine Edition | By Michael Gerrity | June 10, 2021 8:59 AM ET

While the coronavirus pandemic created economic uncertainty for many, the continued acceleration in home prices over the last year has meant existing homeowners saw a notable boost in home equity. The accumulation of equity has become critically important to homeowners deciding on their post-forbearance options. In contrast to the financial crisis, when many borrowers were underwater, borrowers today who are behind on mortgage payments can tap into their equity and sell their home rather than lose it through foreclosure. These conditions are reflected in a recent CoreLogic survey, with 74% of current homeowners with mortgages noting they are not concerned with owing more on their home than it is worth within the next five years.

“Homeowner equity has more than doubled over the past decade and become a crucial buffer for many weathering the challenges of the pandemic,” said Frank Martell, president and CEO of CoreLogic. “These gains have become an important financial tool and boosted consumer confidence in the U.S. housing market, especially for older homeowners and baby boomers who’ve experienced years of price appreciation.”

WPJ News | Frank Nothaft, Freddie Mac's chief economist
Dr. Frank Nothaft

“Double-digit home price growth in the past year has bolstered home equity to a record amount. The national CoreLogic Home Price Index recorded an 11.4% rise in the year through March 2021, leading to a $216,000 increase in the average amount of equity held by homeowners with a mortgage,” said Dr. Frank Nothaft, chief economist for CoreLogic. “This reduces the likelihood for a large number of distressed sales of homeowners to emerge from forbearance later in the year.”

Negative equity, also referred to as underwater or upside down, applies to borrowers who owe more on their mortgages than their homes are currently worth. As of the first quarter of 2021, negative equity share, and the quarter-over-quarter and year-over-year changes, were as follows:

  • Quarterly change: From the fourth quarter of 2020 to the first quarter of 2021, the total number of mortgaged homes in negative equity decreased by 7% to 1.4 million homes, or 2.6% of all mortgaged properties.
  • Annual change: In the fourth quarter of 2020, 1.8 million homes, or 3.4% of all mortgaged properties, were in negative equity. This number decreased by 24%, or 450,000 properties, in the first quarter of 2021.
  • National aggregate value: The national aggregate value of negative equity was approximately $273 billion at the end of the first quarter of 2021. This is down quarter over quarter by approximately $8.1 billion, or 2.9%, from $281.1 billion in the fourth quarter of 2020, and down year over year by approximately $13.3 billion, or 4.6%, from $286.3 billion in the first quarter of 2020.

Because home equity is affected by home price changes, borrowers with equity positions near (+/- 5%) the negative equity cutoff are most likely to move out of or into negative equity as prices change, respectively. Looking at the first quarter of 2021 book of mortgages, if home prices increase by 5%, 195,000 homes would regain equity; if home prices decline by 5%, 260,000 would fall underwater.


Home Price Appreciation Is as Simple as Supply and Demand

Home price appreciation continues to accelerate. Today, prices are driven by the simple concept of supply and demand. Pricing of any item is determined by how many items are available compared to how many people want to buy that item. As a result, the strong year-over-year home price appreciation is simple to explain. The demand for housing is up while the supply of homes for sale hovers at historic lows.

Let’s use three maps to show how this theory continues to affect the residential real estate market.

Home Price Appreciation Is as Simple as Supply and Demand | MyKCM

Map #1 – State-by-state price appreciation reported by the Federal Housing Finance Agency (FHFA) for the first quarter of 2021 compared to the first quarter of 2020:As the map shows, certain states (colored in red) have appreciated well above the national average of 12.6%.

Home Price Appreciation Is as Simple as Supply and Demand | MyKCM

Map #2 – The change in state-by-state inventory levels year-over-year reported by realtor.com:Comparing the two maps shows a correlation between change in listing inventory and price appreciation in many states. The best examples are Idaho, Utah, and Arizona. Though the correlation is not as easy to see in every state, the overall picture is one of causation.

The reason prices continue to accelerate is that housing inventory is still at all-time lows while demand remains high. However, this may be changing.

Is there relief around the corner?

The report by realtor.com also shows the monthly change in inventory for each state.

Home Price Appreciation Is as Simple as Supply and Demand | MyKCM

Map #3 – State-by-state changes in inventory levels month-over-month reported by realtor.com:As the map indicates, 39 of the 50 states (plus the District of Columbia) saw increases in inventory over the last month. This may be evidence that homeowners who have been afraid to let buyers in their homes during the pandemic are now putting their houses on the market.

We’ll know for certain as we move through the rest of the year.

Bottom Line

Some are concerned by the rapid price appreciation we’ve experienced over the last year. The maps above show that the increases were warranted based on great demand and limited supply. Going forward, if the number of homes for sale better aligns with demand, price appreciation will moderate to more historical levels.