Contrary to the negative reports surrounding the market, people continue to move. Not everyone can or wants to wait. Job changes, growing families, downsizing, and other life events often dictate timing more than market trends. That’s why I start with the numbers. Not very exciting, I know but they’re essential. Understanding the data fosters informed decisions and an easier, less stressful path toward your unique real estate goals. I’m here to provide the numbers, break them down, demonstrate how they may affect you and guide you through the best way forward. DM me any time, and/or book a planning session.
After roughly four months of improving mortgage rates, the tides have turned and rates are near 7% once again. Rates reached a recent low of 6.08% in late September, before climbing up to 6.9% in the most recent week. Mortgage rates have remained above 6% since September 2022, keeping many would-be sellers “locked in“ and hindering total inventory recovery.
Housing supply has improved over the past year but remains below pre-pandemic levels. Scarce inventory has kept upward pressure on home prices, especially in affordable areas where homes continue to sell at a quick clip and buyers face considerable competition. New-construction inventory has helped fill the gap, and the new-home share of inventory has climbed beyond pre-pandemic levels. As a result, new-home sales climbed annually for the majority of months in the past couple of years.
In the third quarter of 2024, 21.3% of outstanding mortgages had an interest rate below 3%. The Freddie Mac fixed rate on a 30-year loan dipped below 3% in July 2020, and generally stayed below the 3% threshold through September 2021. Highlighting how extraordinary these conditions were, this was the only period in the data’s history (since 1971) where rates dropped below this threshold.
Outstanding Mortgage Rate
Share of Mortgages (2024 Q3)
Cumulative Share
< 3%
21.3%
21.3%
3% to 4%
33.9%
55.2%
4% to 5%
18.1%
73.3%
5% to 6%
9.5%
82.8%
6% +
17.2%
100%
Roughly a third (33.9%) of outstanding mortgages have an interest rate between 3% and 4%, 18.1% have a rate between 4% and 5%, 9.5% have a rate between 5% and 6%, and 17.2% have a rate of 6% or greater.
Altogether, this means that more than half of outstanding mortgages have a rate of 4% or lower, and roughly three-quarters have a rate of 5% or lower. Looking at the year ahead, we expect that by the end of 2025, the share of mortgages below 6% could fall close to 75%. Put differently, we expect the share of mortgage holders with a rate of 6% or higher to increase by roughly 8 percentage points.
The share of homeowners holding a mortgage with a rate of 6% or higher increased nearly 5 percentage points between Q3 2023 and Q3 2024 as buyer activity carried on, despite high rates. Even in today’s high-price, high-rate market, homebuying activity around big life events (kids, marriage, divorce, etc.) keeps the market in motion. Though the lock-in effect continues to affect the market, a recent survey revealed that a sizable 40% of potential buyers would find a home purchase feasible if mortgage rates were to drop below 6%, and 32% of buyers would be willing to participate if rates dropped below 5%. Easing inflation and mortgage rates will be key drivers of seller activity, which will relieve some of the price pressure and competition felt in today’s under-supplied market.
If you’re wondering what’s going on with home prices lately, you’re definitely not the only one. With so much information out there, it can be hard to figure out your next move.
As a buyer, you might be worried about paying more than you should. And if you’re thinking of selling, you might be concerned about not getting the price you’re aiming for.
So, here’s a quick breakdown to help clear things up and show you what’s really happening with prices—whether you’re thinking about buying or selling.
Home Price Growth Is Slowing, but Prices Aren’t Falling Nationally
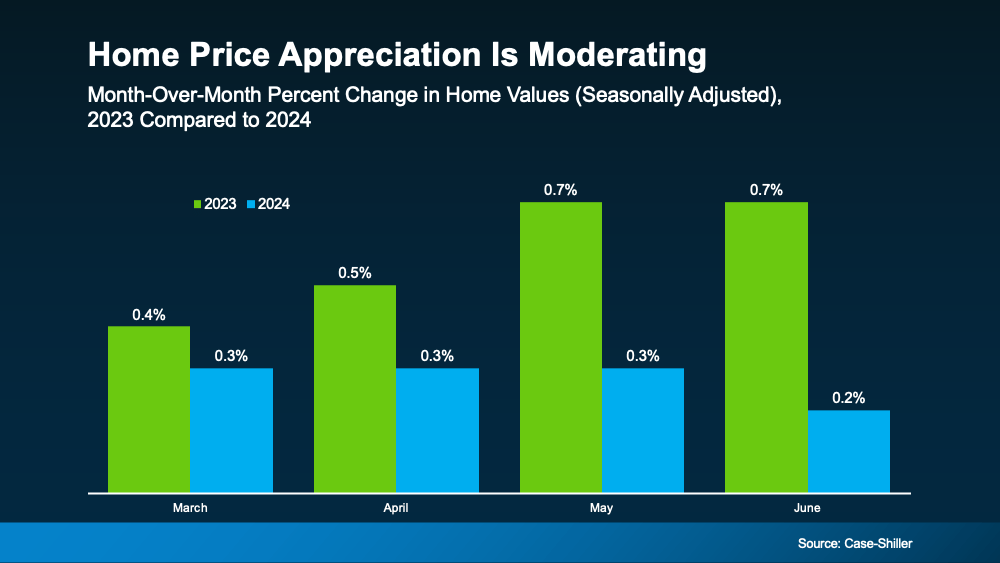
Throughout the country, home price appreciation is moderating. What that means is, prices are still going up, but they’re not rising as quickly as they were in recent years. The graph below uses data from Case-Shiller to make the shift from 2023 to 2024 clear:
But rest assured, this doesn’t mean home prices are falling. In fact, all the bars in this graph show price growth. So, while you might hear talk of prices cooling, what that really means is they’re not climbing as fast as they were when they skyrocketed just a few years ago.
What’s Next for Home Prices? It’s All About Supply and Demand
You might be curious where prices will go from here. The answer depends on supply and demand, and it’s going to vary by local market.
Nationally, the number of homes for sale is going up, but there still aren’t enough of them to meet today’s buyer demand. That’s keeping upward pressure on prices – even though recent inventory growth has caused that home price appreciation to slow. Danielle Hale, Chief Economist at Realtor.com, said:
“. . . today’s low but quickly improving for-sale inventory has ushered in more market balance than would otherwise be expected . . . This should help home prices maintain a slower pace of growth.”
And here’s one other thing you may not have considered that could play a role in where prices go from here. Since experts say mortgage rates should continue to decline, it’s likely more buyers will re-enter the market in the months ahead. If demand picks back up, that could make prices climb a bit further.
Why You Should Work with a Local Real Estate Agent
While national trends give a big-picture view, real estate is always local – especially when it comes to prices. What’s happening in your neighborhood might be different from the national average based on what supply and demand look like in your market. That’s why it’s crucial to get local insights from a knowledgeable real estate agent.
As your go-to source for everything related to home prices, a local agent can provide the most current data and trends specific to your area.
So, if you’re planning to sell, they can help you price your house accurately. And when you’re ready to buy, they can find the right home that fits your budget and your needs.
Bottom Line
Home prices are still rising, just not as quickly as before. Whether you’re thinking about buying, selling, or just curious about what your house is worth, let’s connect so you have the personalized guidance you need.
If you’ve been keeping an eye on the housing market over the past couple of years, you know sellers have had the upper hand. But is that going to shift now that inventory is growing? Here’s a breakdown of what you need to know.
What Is a Balanced Market?
A balanced market is generally defined as a market with about a five-to-seven-month supply of homes available for sale. In this type of market, neither buyers nor sellers have a clear advantage. Prices tend to stabilize, and there’s a healthier number of homes to choose from. And after many years when sellers had all the leverage, a more balanced market would be a welcome sight for people looking to move. The question is – is that really where the market is headed?
After starting the year with a three-month supply of homes nationally, inventory has increased to four months. That may not sound like a lot, but it means the market is getting closer to balanced – even though it’s not quite there yet. It’s important to note this increase in inventory is not leading to an oversupply that would cause a crash. Even with the growth lately, there’s still nowhere near enough supply for that to happen.
The graph below uses data from the National Association of Realtors (NAR) to give you an idea of where inventory has been in the past, and where it’s at today:
For now, this is still seller’s market territory – it’s just not as frenzied of a seller’s market as it’s been over the past few years. As Mark Fleming, Chief Economist at First American, says:
“The faster housing supply increases, the more affordability improves and the strength of a seller’s market wanes.”
What This Means for You and Your Move
Here’s how this shift impacts you and the market conditions you’ll face when you move. Lawrence Yun, Chief Economist at NAR, explains:
“Homes are sitting on the market a bit longer, and sellers are receiving fewer offers. More buyers are insisting on home inspections and appraisals, and inventory is definitively rising on a national basis.”
The graphs below use the latest data from NAR and Realtor.com to help show examples of these changes:
Homes Are Sitting on the Market Longer: Since more homes are on the market, they’re not selling quite as fast. For buyers, this means you may have more time to find the right home. For sellers, it’s important to price your house right if you want it to sell. If you don’t, buyers might choose better-priced options.
Sellers Are Receiving Fewer Offers: As a seller, you might need to be more flexible and willing to compromise on price or terms to close the deal. For buyers, you could start to face less intense competition since you have more options to choose from.
Fewer Buyers Are Waiving Inspections: As a buyer, you have more negotiation power now. And that’s why fewer buyers are waiving inspections. For sellers, this means you need to be ready to negotiate and address repair requests to keep the sale moving forward.
How a Real Estate Agent Can Help
But this is just the national picture. The type of market you’re in is going to vary a lot based on how much inventory is available. So, lean on a local real estate agent for insight into how your area stacks up.
Whether you’re buying or selling, understanding how the market is changing gives you a big advantage. Your agent has the latest data and local insights, so you know exactly what’s happening and how to navigate it.
Bottom Line
The real estate market is always changing, and it’s important to stay informed. Whether you’re buying or selling, understanding this shift toward a balanced market can help. If you have any questions or need expert advice, don’t hesitate to reach out.
In today’s housing market, many sellers are making a critical mistake: overpricing their houses. This common error can lead to a home sitting on the market for a long time without any offers. And when that happens, the homeowner may have to drop their asking price to try to re-ignite buyer interest.
Data from Realtor.com shows the number of homeowners realizing this mistake and doing a price reduction is climbing (see graph below):
If you’re thinking about making a move yourself, here’s what you need to know. The best way to avoid making a costly mistake is to work with a trusted real estate agent to find the right price. Here’s a look at what’s at stake if you don’t.
Not Paying Attention To Current Market Conditions
Understanding current market conditions is key to accurate pricing. You don’t want to set your asking price based on what happened during the pandemic. The market has moderated a lot since then, so it’s far better to align your price with today’s reality.
Real estate agents stay updated on market trends and how they impact the pricing strategy for your house.
Pricing It Based on What You Want To Make (Not What It’s Worth)
Another misstep is pricing it based on what you want to make on the sale, and not necessarily current market value. You may see other homes in your neighborhood selling for top dollar and assume yours can do the same. But you may not be considering differences in size, condition, and features. For example, maybe that other house is waterfront or has a finished basement. To sum it up, Bankrate explains:
“How do you find that sweet spot of pricing for profit but not overpricing? The expertise of your agent can be truly valuable here. A knowledgeable agent will understand fair market value in your area, how much your house is worth and how much you might reasonably expect to get for it in the current market.”
An agent will do a comparative market analysis (CMA) to make sure your house is compared with truly similar properties to get an accurate look at how it should be priced.
Pricing High to Leave Room for Negotiation
Another common, yet misguided strategy is to price your house high on purpose, so you have more room to negotiate down during the sale. But this can backfire. A price that seems too high often deters potential buyers from even considering the home. So rather than leaving room for negotiation, what you’ll actually be doing is turning buyers away. U.S. News Real Estate explains:
“You want to sell your house for top dollar, but be realistic about the value of the property and how buyers will see it. If you’ve overpriced your home, chances are you’ll eventually need to lower the number, but the peak period of activity that a new listing experiences is already gone.”
An agent can help you set a fair price that attracts buyers and encourages more competitive offers.
Bottom Line
Overpricing your home can have serious consequences. A knowledgeable real estate agent brings an objective perspective, in-depth market knowledge, and a strategic approach to pricing.
Let’s connect so you can avoid making a pricing mistake that’ll cost you.
Freddie Mac Chief Economist: “New data indicate inflationary pressures are receding” – which, along with lower mortgage rates, may lure more homebuyers into the market.
JONESBORO, Ga. – Mortgage rates have fallen for three straight weeks, with the 30-year fixed rate averaging 7.44% Thursday, down from 7.5% a week earlier, according to Freddie Mac.
But the rate remains well above last year’s level – 6.61%.
Why did the rate go down this week? “New data indicate that inflationary pressures are receding,” said Sam Khater, Freddie Mac’s chief economist.
The government reported Nov. 14 that consumer prices climbed 3.2% in the 12 months ended in October, decelerating from 3.7% in September.
“The combination of continued economic strength, lower inflation and lower mortgage rates should likely bring more potential homebuyers into the market,” Khater said.
Housing sales slump
But so far this year, high mortgage rates have stifled sales.
Existing-home sales slid 2% in September from August, according to the National Association of Realtors (NAR). Sales retreated 15.4% from a year ago.
“As has been the case throughout this year, limited inventory and low housing affordability continue to hamper home sales,” said NAR Chief Economist Lawrence Yun.
But with inventory limited, demand has been strong enough, despite the mortgage rate increase, to push home prices higher. The median existing-home price registered $394,300 in September, up 2.8% from $383,500 a year earlier.
“Lack of inventory is providing the support for high prices, but it’s also making it super difficult for first-time buyers to enter the housing market,” Yun noted.
Yun expects the depressed state of sales to last through year-end, with home sales dropping 18% for 2023 as a whole. That comes after a 17% decline last year.
Light at the end of the tunnel?
But things are starting to look up on the supply side. The inventory of unsold existing homes climbed 2.7% in September from August to 1.13 million. That’s the equivalent of 3.4 months’ supply at the current monthly sales pace. Six months is typically considered a balanced market.
“Builders are back on their feet, up 5% in newly constructed home sales year to date,” Yun said. “Builders can simply create inventory. In a housing shortage environment, builders are really benefiting.”
And mortgage rates may have topped out. Many economists believe inflation is falling enough to keep the Federal Reserve from raising rates again.
“I believe we’ve already reached the peak in terms of interest rates,” Yun said. “The question is when are rates going to come down?”
He forecast mortgage rates will slide to 6%-7% by the spring buying season and anticipates that more sellers will then enter the market.
Still, if you’re a renter who wants to buy, you might want to hold off until housing prices correct. For many, mortgage payments are just too high for a house to be affordable. The rule of thumb is that no more than 28% of your income should be needed to pay a mortgage.
If you’re weighing your options to decide whether it makes more sense to rent or buy a home today, here’s one key data point that could help you feel more confident in making your decision. Every three years, the Federal Reserve Board releases the Survey of Consumer Finances (SCF). That report covers the difference in net worth for both homeowners and renters. Spoiler alert: the gap between the two is significant.
The average homeowner’s net worth is almost 40X greater than a renter’s. And here’s the data to prove it (see graph below):
The Big Reason Homeowner Net Worth Is So High
In the previous version of that report, the net worth of the average homeowner was roughly $255,000 and that of the average renter was $6,300. But in the release that just came out this year, the gap widened as homeowner net worth climbed dramatically. As the Survey of Consumer Finances (SCF) report says:
“. . . the 2019-2022 growth in median net worth was the largest three-year increase over the history of the modern SCF, more than double the next-largest one on record.”
One of the biggest reasons homeowner net worth skyrocketed is home equity.
Over the last few years, known as the ‘unicorn’ years for housing, home prices went through the roof. That’s because there weren’t enough homes for sale, and there was a big influx of buyers rushing to buy them and take advantage of the then record-low mortgage rates. That imbalance of supply and demand pushed prices higher and higher. As a result, most homeowners who had a home during that time saw their equity grow a lot.
If you’re still in the middle of making your decision on whether to rent or buy, you may wonder if you missed the boat on the big net worth boost. But here’s what you need to realize. As a recent article in The Ascentexplains:
“Whether your net worth increased in recent years or not, there are steps you can take to boost that number in the coming years. . . buying a home can be a great way to grow your net worth, since home values have a tendency to rise over time.”
Historically, home prices climb over time. Even now that mortgage rates are closer to 7-8%, prices are still rising in many areas of the country because supply is still low compared to demand. That’s why expert forecasts for the next few years call for ongoing appreciation – just at a pace that’s more typical for the housing market.
While it likely won’t be the record ramp-up that happened over the last few years, people who buy now should continue to grow equity in the years ahead. That means, if you’re ready and able to buy a home today, you’ll be making an investment that’ll help build your net worth in the long run.
As Jessica Lautz, Deputy Chief Economist at the National Association of Realtors (NAR), says:
“. . . when deciding to rent vs buy, one must calculate the total cost of homeownership (maintenance, utilities, commuting, etc.) and the total financial benefit. Based on new Fed data . . . the median net worth of homeowners was $396,200 vs renters at $10,400. There is no question about the wealth gains that homeownership provides.”
Bottom Line
If you’re on the fence about whether to rent or buy a home, remember that homeownership can give your net worth a big boost over time. If you want to learn more about this or the many other benefits of owning a home, let’s connect.
Spring is around the corner, and the signs are pointing to a pick-up in sales on the horizon. Read more from NAR’s latest housing report.
Existing-home sales continued to ease in January, marking a yearlong stretch of declines coming off pandemic-fueled highs. But median home prices still are rising.
Total existing-home sales—completed transactions that include single-family homes, townhomes, condos and co-ops—decreased 0.7% in January compared to December 2022, the National Association of REALTORS® reported Tuesday. Home sales are down nearly 37% compared to a year earlier (at a seasonally adjusted annual rate of 4 million in January).
But as mortgage rates begin to stabilize, economists are hopeful for a turnaround in sales activity for the housing market heading into spring.
“Home sales are bottoming out,” says Lawrence Yun, NAR’s chief economist. “Prices vary depending on a market’s affordability, with lower-priced regions witnessing modest growth and more expensive regions experiencing declines.”
Overall, the median existing-home sales price nationwide rose 1.3% compared to a year ago, reaching $359,000, NAR reports. Home prices climbed in three out of the four major regions of the U.S., only falling in the West last month.
The supply of homes for sale continues to be tight in most markets across the country, helping to keep home prices higher. Still, total housing inventory rose 2.1% in January month-over-month and is up by 15.3% compared to a year ago. Unsold inventory, remains, at a brisk, 2.9-month supply at the current sales pace.
“Inventory remains low, but buyers are beginning to have better negotiating power,” Yun says. “Homes sitting on the market for more than 60 days can be purchased for around 10% less than the original list price.”
Here’s a closer look at other key indicators from NAR’s latest housing report: Days on the market: Fifty-four percent of homes sold in January were on the market for less than a month in January. On average, properties remained on the market for 33 days in January, up from 26 days in December and 19 days a year earlier. First-time home buyers: As competition lessens, first-time home buyers are re-emerging. First-time buyers accounted for 31% of sales in January, up from 27% a year earlier. All-cash sales: All-cash transactions comprised 29% of sales in January, up from 27% in January 2022. Individual investors and second-home buyers tend to make up the biggest bulk of all-cash sales. They purchased 16% of homes in January, down from 22% a year earlier. Distressed sales: Foreclosures and short sales continue to make up a very small share of sales. Distressed sales accounted for 1% of sales in January, matching levels from a year earlier.
Regional Snapshot Here’s how existing-home sales fared across the country in January:
Northeast: Existing-home sales fell 3.8% from December, reaching an annual rate of 500,000 in January. Sales were down nearly 36% from a year earlier. Median price: $383,000, up 0.3% from January 2022
Midwest: Sales decreased 5% compared to the previous month, reaching an annual rate of 960,000 in January. Sales were down 33.3% from one year ago. Median price: $252,300, up 2.7% from January 2022
South: Sales rose 1.1% in January compared to December, reaching an annual rate of 1.82 million. Sales are down nearly 37% from the prior year. Median price: $332,500, an increase of 3.4% from one year ago
West: Existing-home sales increased 2.9% in January, reaching an annual rate of 720,000, but still down 42.4% from the previous year. Median price: $525,200, down 4.6% from January 2022
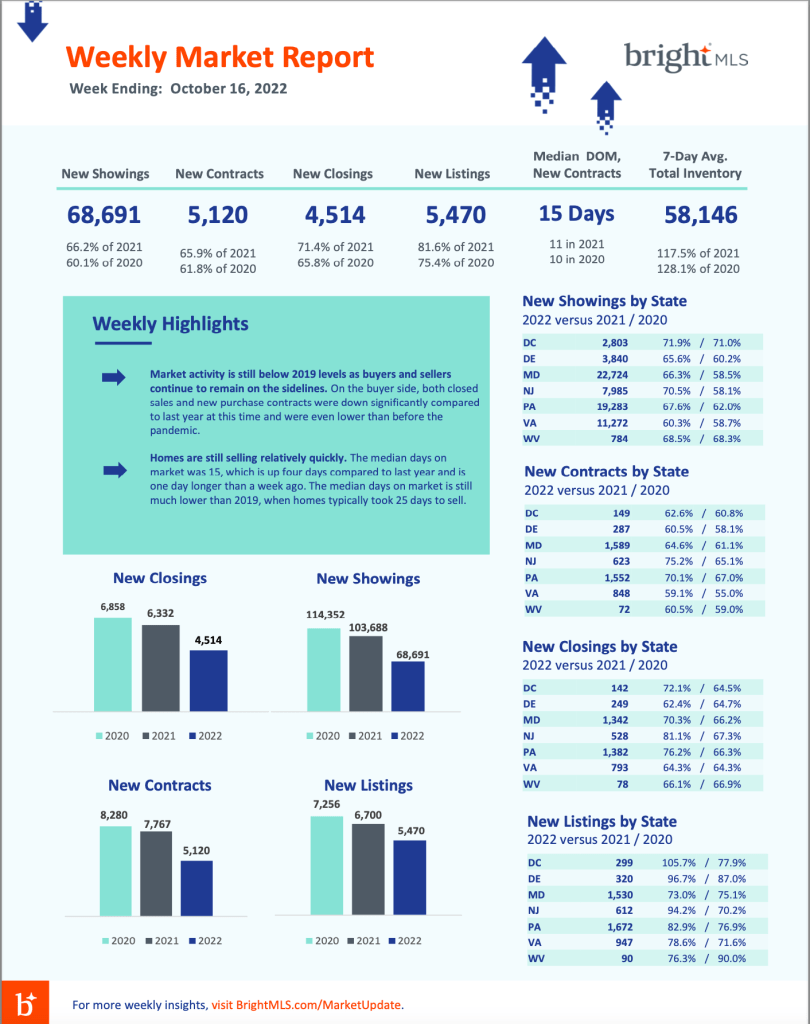
Access this weekly report for real-time data on residential market activity across the Bright MLS footprint. October 17, 2022 Lisa Sturtevant, PhD
Here are the highlights for the week ending October 16, 2022:
Inventory continues to increase throughout the Bright footprint. The average number of active listings during the week ending October 16 was up 17.5% compared to the same week a year ago. Active listings edged up 0.9% compared to last week, which is the second weekly increase in a row. Despite these increases, overall supply across the region remains very low.
Market activity is still below 2019 levels as buyers and sellers continue to remain on the sidelines. On the buyer side, both closed sales and new purchase contracts were down significantly compared to last year at this time and were even lower than before the pandemic. Closed sales this week were about 14% lower than the same week during 2019, while the number of new purchase contracts tracked 22% lower than during the same week in 2019.
There was a slight uptick in both new purchase activity and new listings compared to a week ago. Typically, both the number of new purchase contracts and new listings decline during the second week of October. This year, however, there were slight increases, with new purchase contracts 2.1% higher than a week ago and new listings up 3.0% week-to-week. These weekly increases could indicate some buyers and sellers are starting to act in anticipation of higher mortgage rates later this fall.
Homes are still selling relatively quickly. The median days on market was 15 during the week ending October 16, which is up four days compared to last year and is one day longer than a week ago. The median days on market is still much lower than 2019, when homes typically took 25 days to sell.
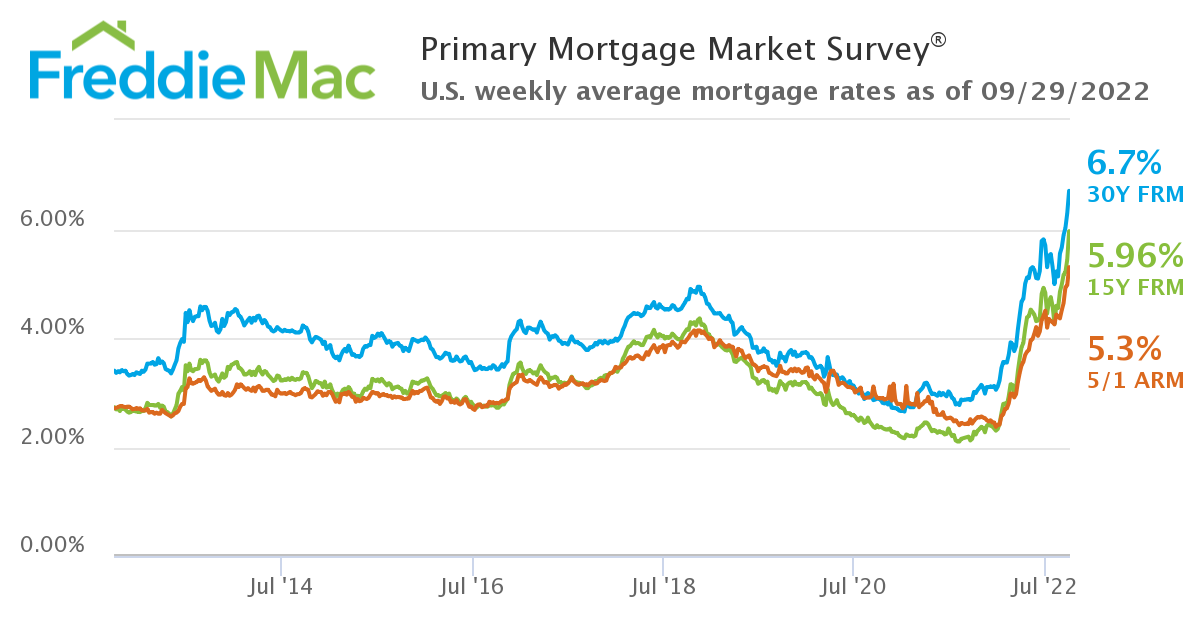
Interest rates for the average 30-yr, fixed-rate mortgage according to Freddie Mac’s PMMS hit:
4% in March 😟 5% in April 😰 6% in early-September 😨 7% (well, almost) in late-September 😱
The slowdown continues, but we have yet to see the impact of the most recent (massive) jump in mortgage rates on homebuyer demand.
August existing home sales dropped for the 7th straight month. Price growth decelerated further to “just” 8% YoY. [Source: Realtor.com]
Meanwhile, pending sales for August dropped 2% MoM and 24% YoY. The NAR now forecasts existing home sales to fall 15% YoY in 2022, with new home sales down 21% YoY. [Source: NAR]
Case-Shiller Index
Home price growth slowed to 15.8% YoY in July, from 18.1% YoY in June. That may not seem like much, but it’s the biggest 1-month drop in the index’s history.
Case-Shiller is the gold standard for home price appreciation because it tracks the sales prices of very similar homes across 20 big cities. It’s an ‘apples to apples’ comparison. But that accuracy comes at a cost…the data is 2 months old by the time we get it.
Mortgage Market
An extremely volatile week for the bond market (after the Fed raised rates 75bps) saw 30-year, fixed-rate mortgages briefly exceed 7% [with no points], before dropping back to around 6.75%. [Source: Mortgage News Daily]
Freddie Mac’s closely watched PMMS survey saw the interest rate on the average 30-year, fixed-rate mortgage climb to 6.7%. Keep in mind that this figure includes an average 0.9 points purchased. Without those points, the rate would have been at/ahead of 7%.
Still a Seller’s Market
Demand is falling and inventory has risen, but in most markets, well-priced homes are still selling very, very quickly.
In fact, the average Days on Market for sold properties has only edged up from 14 (in June & July) to 16 in August. In 2011 that figure was 96! Looked at another way, 81% of homes sold in August had been on the market less than a month.
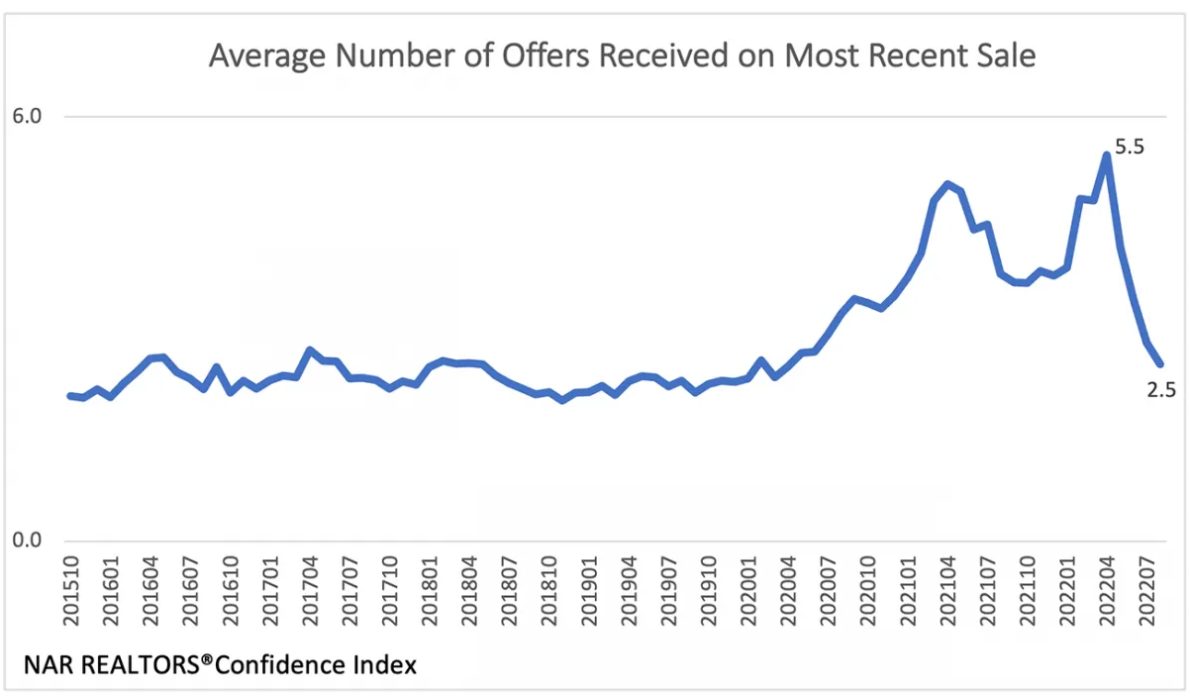
That said, the average number of offers received for each property sold has plunged from a frenzied 5.5 in April 2022 to 2.5 in August. That’s actually getting pretty close to “normal” pre-pandemic levels of competition.
National Housing Stats
They Said It
“Success demands singleness of purpose. You need to be doing fewer things for more effect instead of doing more things with side effects. It is those who concentrate on one thing at a time who advance in this world.” — Gary Keller, The One Thing
“Our house is clean enough to be healthy and dirty enough to be happy” — Robyn Griggs Lawrence
Inspiration
The average duration of homeownership in the US is around 12 years. So if someone in your sphere of influence (SOI) bought a home in the last few years, there’s no reason to actively stay in touch with them, right? Wrong. Take the inverse of 12 (that’s 1/12) and you get 8.3%.
This means that, mathematically, 8% of your SOI is going to move in the next year…for reasons that you (and often they) couldn’t have predicted. Hockey legend Wayne Gretzky said “you miss 100% of the shots you don’t take.” In real estate, you probably lose 80–90% of the past clients that you don’t stay in contact with.